bdrmap: Inference of Borders Between IP Networks
December 1st, 2016 by Josh PolterockMatthew Luckie presented some recent topology research results of CAIDA’s NSF-funded Internet interconnection mapping project at the recent ACM 2016 Internet Measurement Conference in Santa Monica, CA. This measurement, data analysis, and software tool development project focused on automatic inference of network boundaries in traceroute. The paper explains why such a conceptually simple task is hard in the real world, and how lack of progress has impeded a wide range of research and development efforts for decades. We developed and validated a method that uses targeted traceroutes, knowledge of traceroute idiosyncrasies, and codification of topological constraints in a structured set of heuristics, to correctly identify interdomain links at the granularity of individual border routers. We limited our scope to those network boundaries we have most confidence we can accurately infer in the presence of inherent sampling bias: interdomain links attached to the network launching the traceroute. We developed a scalable implementation of our algorithm and validated it against ground truth information provided by four networks on 3,277 links, which showed 96.3% – 98.9% of our inferences for these links were correct. With 19 vantage points (VPs) distributed across a large U.S. broadband provider, we used our method to reveal the tremendous density of router-level interconnection between some ASes. For example, in January 2016, we observed 45 router-level links between one large U.S. broadband provider and one of its Tier-1 peers. We also quantified the VP deployment required to observe this ISP’s interdomain connectivity, finding that we needed 17 VPs to observe all 45 links. Our method forms the cornerstone of the system we are now building to map interdomain performance. We released our code as a new module of the open source scamper measurement tool.
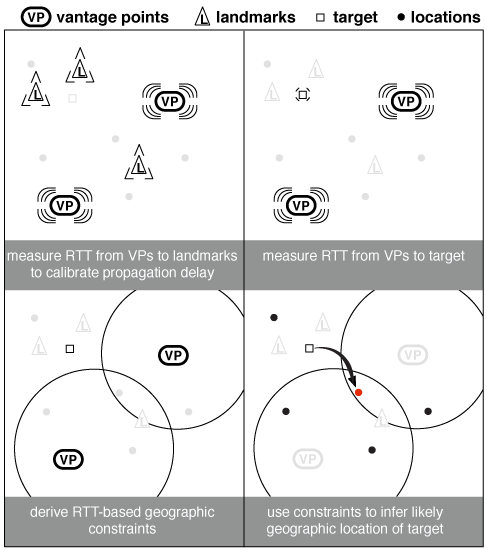
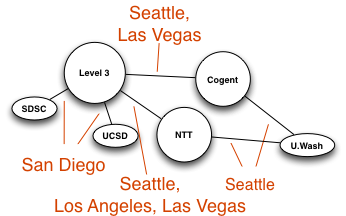
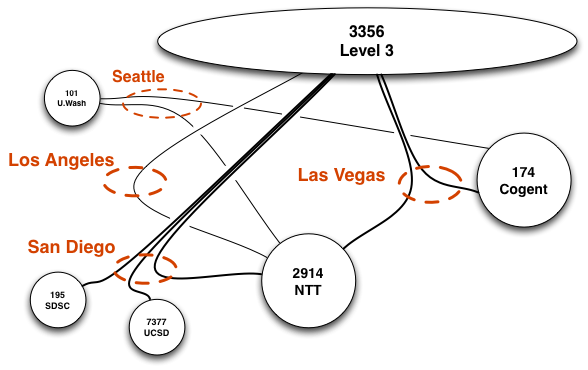
Our approach begins with assembling routing and addressing data used to inform data collection and analysis. Then, we deploy an efficient variant of traceroute to trace the path from each VP to every routed prefix observed in the global BGP routing system. We apply alias resolution techniques to infer routers and point-to-point links used for interdomain interconnection. We then use this collected data to assemble constraints that guide our execution of heuristics to infer router ownership.
The data collected on the Ark infrastructure using this new methodology to construct an improved router-level map will provide input for development of applications and experiments in several research areas including studies on interdomain congestion, better solutions for AS path prediction and development of a reliable tool for AS-level traceroute.
This work was supported by NSF-funded grant: CNS-1414177, and the DHS S&T contracts N66001-12-C-0130 and HHSP 233201600012C.