CAIDA’s 2022 Annual Report
Monday, July 10th, 2023 by kcThe CAIDA annual report summarizes CAIDA’s activities for 2022 in the areas of research, infrastructure, data collection and analysis. The executive summary is excerpted below:
(more…)
The CAIDA annual report summarizes CAIDA’s activities for 2022 in the areas of research, infrastructure, data collection and analysis. The executive summary is excerpted below:
(more…)
In November 2022, 85% MANRS members were conformant to Action #1 and Action #4.
The Mutually Agreed Norms on Routing Security (MANRS) initiative is an industry-led effort to improve Internet routing security. MANRS encourages participating networks to implement a series of routing security practices. In our paper, Mind Your MANRS: Measuring the MANRS Routing Ecosystem, we at CAIDA (UC San Diego), in collaboration with Georgia Tech, and IIJ Research Lab, provided the first independent look into the MANRS ecosystem by using publicly available data to analyze the routing behavior of participant networks. MANRS membership has increased significantly in recent years, but our research goal was to get more clarity on the impact of the MANRS initiative on the state of overall Internet routing security. In this post, we summarize how we characterized the growth of MANRS members, explain our process of analyzing ISP conformance with the MANRS practices we studied, compare RPKI ROA registration status between MANRS and non-MANRS members, and reflect on implications of our analysis for the future of MANRS.
We first analyzed what types of networks have joined MANRS over time, and whether MANRS members are properly implementing the routing security practices (MANRS conformance). The two practices (which MANRS calls actions) we focused on in our study are:
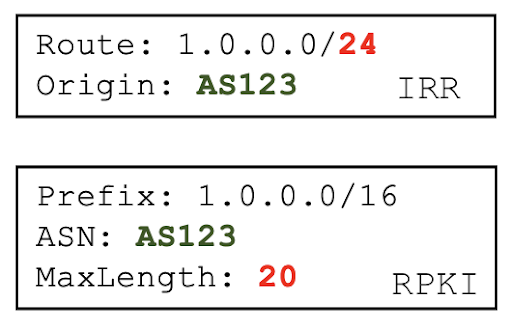
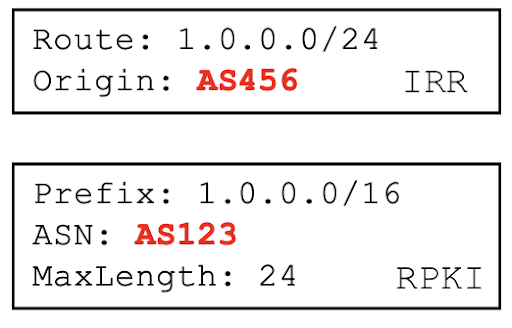
Our paper analyzed the MANRS ecosystem in May 2022. Since MANRS is a growing community, for this post we have updated our analysis using data collected in November 2022 to capture a more recent view of the MANRS ecosystem. We have also published our analysis code here for interested readers to reproduce the analysis using the latest available data.
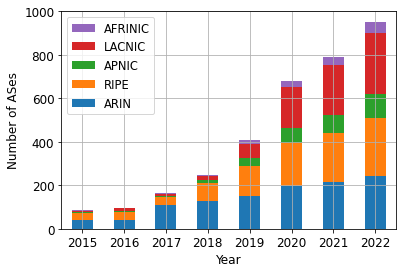
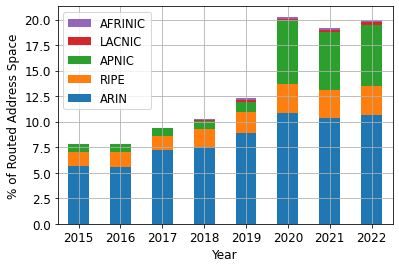
We first downloaded a list of MANRS members. The Internet Society kindly provided us the dates when each MANRS participant joined the programs. We found that between 2015 and November 2022, 863 ASes joined MANRS. Over this 7-year period, an additional 12.1% of routed IPv4 address space was originated by MANRS ASes. Plotting growth by ASes and by address space (Figure 1) shows that most of these new ASes were based in the LACNIC region, but that those ASes originated little or no address space into BGP.
(a)
(b)
Figure 1 – MANRS participation grew between 2015 and 2022, but the picture looks quite different if measured by number of ASes vs. % of routed address space.
We examined whether MANRS (ISP and CDN) members properly implemented MANRS Action #4 and #1 according to the MANRS requirements:
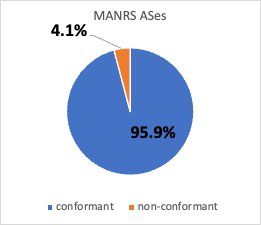
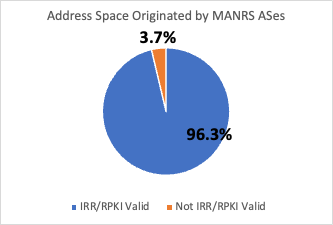
We downloaded BGP prefixes and their IRR/RPKI status from the Internet Health Report (IHR) maintained by IIJ Research Labs. We found that in November 2022, 893 (95.9%) of all 931 MANRS ASes conformed to MANRS Action #4 (prefix registration). Figure 2 shows that in November 2022, 3.7% of the address space originated by MANRS ASes was contained in prefixes that either were not registered or were incorrectly registered in IRR or RPKI. We also conducted case studies of non-conformant MANRS CDN members and found that one large CDN was not conformant because one of their 7000+ prefixes was RPKI-invalid. Please refer to section 8.4 of the paper for more details.
(a)
(b)
Figure 2 – Most ASes participating in MANRS conformed with Action #4, and correspondingly, most of the address space those ASes originated into BGP was IRR or RPKI valid, i.e., had records that matched observed BGP announcements.
To evaluate whether MANRS members filtered out customer BGP announcements that do not match IRR or RPKI records (Action #1), we downloaded BGP prefixes, their IRR and RPKI statuses, and their upstream ASes from the Internet Health Report. We then calculated the prevalence of IRR/RPKI Invalid prefixes propagated through each MANRS network.
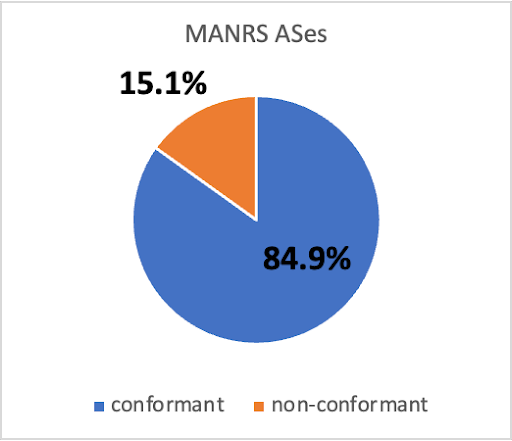
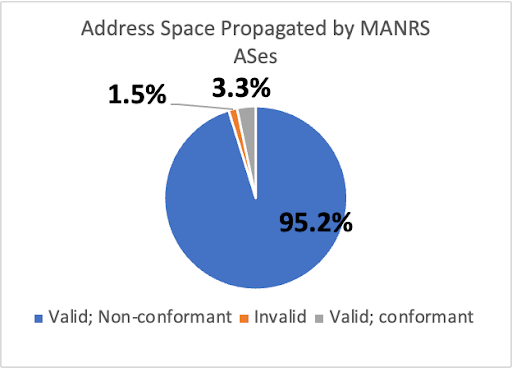
Figure 3 shows that in November 2022, 790 (84.9%) of 931 MANRS ASes conformed to the MANRS Action #1 . Figure 3 also shows that 141 (15.1%) MANRS ASes did not conform to Action #1. However, not all of the address space propagated by these ASes was incorrectly registered in RPKI or IRR. In fact, those 141 ASes propagated 96.7% of the address space propagated by MANRS ASes, but only 1.5% of that total was incorrectly registered. In addition, we found that 25 out of 27 MANRS members that are large transit providers (i.e., had > 180 customer ASes) did not fully conform with MANRS Action #1, suggesting that conformance was hard to achieve for networks with complex routing relationships.
(a)
(b)
Figure 3 – MANRS ASes that did not conform to MANRS Action #1 only propagated a small fraction of address space announced by MANRS ASes that was not IRR or RPKI Valid. (b) shows 95.2% of MANRS-propagated address space was IRR/RPKI Valid despite being propagated by Action #1 non-conformant members.
Our study found that, except for a few cases, MANRS organizations tended to conform with the two actions we studied. However, to estimate the impact of the MANRS initiative on the state of routing security, we compared the behavior of MANRS and non-MANRS ASes.
We first compared these two subsets of ASes in terms of registration of RPKI ROAs of prefixes announced in BGP. In November 2022, 60.1% of routed IPv4 address space originated by MANRS ASes was covered by RPKI ROAs, compared with only 38.8% of all routed IPv4 addresses covered by ROAs. Figure 5 shows that in November 2022, IPv4 address space originated by MANRS ASes was more likely to be registered in RPKI in all RIR regions except APNIC. In the APNIC region, we found significant RPKI registration by non-MANRS networks from JPNIC and TWNIC, possibly due to local RPKI outreach efforts. Overall, this difference suggests a positive influence of MANRS members on the adoption of RPKI.
Similarly, changing the view from routed address space to the originating ASes, we found that in November 2022, MANRS members were more likely to originate at least 80% RPKI Valid prefixes in BGP compared to their non-MANRS counterparts in all RIR regions (Figure 6).
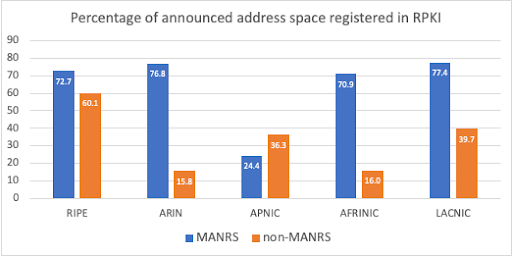
Figure 5 – In November 2022, IPv4 address space originated by MANRS ASes was more likely to be registered in RPKI in all RIR regions except APNIC.
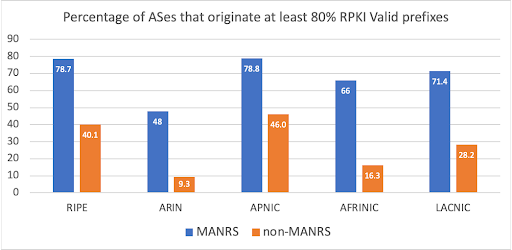
Figure 6 – In November 2022, MANRS ASes were more likely to originate RPKI Valid prefixes than non-MANRS ASes.
In November 2022, we found 71 MANRS ASes that registered their prefixes only in IRR but not RPKI. Registering only in an IRR database is less optimal than registering in RPKI, since some IRR databases may contain inaccurate records due to looser validation standards (See our paper IRR Hygiene in the RPKI Era). We recommend that in the future, MANRS members register in RPKI in addition to IRR databases. We also recommend that MANRS add a conformance checker to its existing observatory to further motivate its members to maintain good routing security practices. We have published our analysis code to facilitate such conformance checking.
The Border Gateway Protocol (BGP) is the protocol that networks use to exchange (announce) routing information across the Internet. Unfortunately, BGP has no mechanism to prevent the propagation of false announcements such as hijacks and misconfigurations. The Internet Route Registry (IRR) and Resource Public Key Infrastructure (RPKI) both emerged as different solutions to improve routing security and operation in the Border Gateway Protocol (BGP) by allowing networks to register information and develop route filters based on information other networks have registered.
The Internet Routing Registry (IRR) was first introduced in 1995 and remained a popular tool for BGP route filtering. However, route origin information in the IRR suffers from inaccuracies due to the lack of incentive for registrants to keep information up to date and the use of non-standardized validation procedures across different IRR database providers.
Over the past few years, the Resource Public Key Infrastructure (RPKI), a system providing cryptographically attested route origin information, has seen steady growth in its deployment and has become widely used for Route Origin Validation (ROV) among large networks.
Some networks are unable to adopt RPKI filtering due to technical or administrative reasons and continue using only existing IRR-based route filtering. Such networks may not be able to construct correct routing filters due IRR inaccuracies and thus compromise routing security.
In our paper IRR Hygiene in the RPKI Era, we at CAIDA (UC San Diego), in collaboration with MIT, study the scale of inaccurate IRR information by quantifying the inconsistency between IRR and RPKI. In this post, we will succinctly explain how we compare records and then focus on the causes of such inconsistencies and provide insights on what operators could do to keep their IRR records accurate.
For our study we downloaded IRR data from 4 IRR database providers: RADB, RIPE, APNIC, and AFRINIC, and RPKI data from all Trust Anchors published by the RIPE NCC. Figure 1 shows IRR cover more IPv4 address space than RPKI, but RPKI grew faster than IRR, having doubled its coverage over the past 6 years.
Figure 1. IPv4 coverage of IRR and RPKI databases. RADB, the largest IRR database, has records representing almost 60% of routable IPv4 address space. In contrast, the RPKI covers almost 30% of that address space but has been steadily growing in the past few years.
We classified IRR records following the procedure in Figure 2: first we check if there is a Route Origin Authorization (ROA) record in RPKI covering the IRR record, then in case there is one if the ASN is consistent, and finally, if the ASN is consistent, we check the prefix length compared to the maximum length attribute of RPKI records. Using this procedure we are left with 4 categories:
Figure 2. Classification of IRR records
As of October 2021, we found only 38% of RADB records with matching ROAs were consistent with RPKI, meaning that there were more inconsistent records than consistent records in RADB, see Figure 3 (left) . In contrast, 73%, 98%, and 93% of RIPE, APNIC, and AFRINIC IRR records were consistent with RPKI, showing a much higher consistency than RADB, see Figure 3 (right).
We attribute the big difference in consistency to a few reasons. First, the IRR database we collected from the RIRs are their respective authoritative databases, meaning the RIRs manages all the prefixes, and verifies the registration of IRR objects with address ownership information. This verification process is stricter than that of RADB and leads to the higher quality of IRR records. Second, APNIC provides its registrants a management platform that automatically creates IRR records for a network when it registers its prefixes in RPKI. This platform contributes to a larger number of consistent records compared to other RIRs.
Figure 3. RIR-managed IRR databases have higher consistency with RPKI compared to RADB.
In our analysis we found that inconsistent max length was mostly caused by IRR records that are too specific, as the example shown in Figure 4, and to a lesser extent by misconfigured max length attribute in RPKI. We also found that inconsistent ASN records are largely caused by customer networks failing to remove records after returning address space to their provider network, such as the example in Figure 5.
Inconsistent Max Length (Figure 4)
Figure 4. IRR record with inconsistent max length: the IRR prefix length exceeds the RPKI max length value.
Inconsistent ASN (Figure 5)
Figure 5. IRR record with inconsistent ASN: the IRR record ASN differs from the RPKI record ASN.
Although RPKI is becoming more widely deployed, we do not see a decrease in IRR usage, and therefore we should improve the accuracy of information in the IRR. We suggest that networks keep their IRR information up to date and IRR database providers implement policies that promote good IRR hygiene.
Networks currently using IRR for route filtering can avoid the negative impact of inaccurate IRR information by using IRRd version 4, which validates IRR information against RPKI, to ignore incorrect IRR records.
Figure 1: This picture shows a line of floating buoys that designate the path of the long-awaited SACS (South-Atlantic Cable System). This submarine cable now connects Angola to Brazil (Source: G Massala, https://www.menosfios.com/en/finally-cable-submarine-sacs-arrived-to-brazil/, Feb 2018.)
The network layer of the Internet routes packets regardless of the underlying communication media (Wifi, cellular telephony, satellites, or optical fiber). The underlying physical infrastructure of the Internet includes a mesh of submarine cables, generally shared by network operators who purchase capacity from the cable owners [2,11]. As of late 2020, over 400 submarine cables interconnect continents worldwide and constitute the oceanic backbone of the Internet. Although they carry more than 99% of international traffic, little academic research has occurred to isolate end-to-end performance changes induced by their launch.
In mid-September 2018, Angola Cables (AC, AS37468) activated the SACS cable, the first trans-Atlantic cable traversing the Southern hemisphere [1][A1]. SACS connects Angola in Africa to Brazil in South America. Most assume that the deployment of undersea cables between continents improves Internet performance between the two continents. In our paper, “Unintended consequences: Effects of submarine cable deployment on Internet routing”, we shed empirical light on this hypothesis, by investigating the operational impact of SACS on Internet routing. We presented our results at the Passive and Active Measurement Conference (PAM) 2020, where the work received the best paper award [11,7,8]. We summarize the contributions of our study, including our methodology, data collection and key findings.
[A1] Note that in the same year, Camtel (CM, AS15964), the incumbent operator of Cameroon, and China Unicom (CH, AS9800) deployed the 5,900km South Atlantic Inter Link (SAIL), which links Fortaleza to Kribi (Cameroon) [17], but this cable was not yet lit as of March 2020.
Responding to feedback from our user community, CAIDA has released version 2.1 of the AS Rank API. This update helps to reduce some of the complexity of the full-featured GraphQL interface through a simplified RESTful API.
AS Rank API version 2.1 adds support for historical queries as well as support for AS Customer Cones, defined as the set of ASes an AS can reach using customer links. You can learn more about AS relationships, customer cones, and how CAIDA sources the data at https://asrank.caida.org/about.
You can find the documentation for AS Rank API version 2.1 here https://api.asrank.caida.org/v2/restful/docs.
You can find documentation detailing how to make use of historical data and customer cones here https://api.asrank.caida.org/v2/docs.
CAIDA Team
Congratulations to Roderick Fanou, Bradley Huffaker, Ricky Mok, and kc claffy, for being awarded Best Paper at the Passive and Active Network Measurement Conference PAM 2020!
The abstract from the paper, “Unintended Consequences: Effects of submarine cables deployment on Internet routing“:
We use traceroute and BGP data from globally distributed Internet measurement infrastructures to study the impact of a noteworthy submarine cable launch connecting Africa to South America. We leverage archived data from RIPE Atlas and CAIDA Ark platforms, as well as custom measurements from strategic vantage points, to quantify the differences in end-to-end latency and path lengths before and after deployment of this new South-Atlantic cable. We find that ASes operating in South America significantly benefit from this new cable, with reduced latency to all measured African countries. More surprising is that end-to-end latency to/from some regions of the world, including intra-African paths towards Angola, increased after switching to the cable. We track these unintended consequences to suboptimally circuitous IP paths that traveled from Africa to Europe, possibly North America, and South America before traveling back to Africa over the cable. Although some suboptimalities are expected given the lack of peering among neighboring ASes in the developing world, we found two other causes: (i) problematic intra-domain routing within a single Angolese network, and (ii) suboptimal routing/traffic engineering by its BGP neighbors. After notifying the operating AS of our results, we found that most of these suboptimalities were subsequently resolved. We designed our method to generalize to the study of other cable deployments or outages and share our code to promote reproducibility and extension of our work
The study presents a reproducible method to investigate the impact of a cable deployment on the macroscopic Internet topology and end-to-end performance. We then applied our methodology to the case of SACS (South-Atlantic Cable System), the first South-Atlantic cable from South America to Africa, using historical traceroutes from both Archipelago (Ark) and RIPE Atlas measurement platforms, BGP data, etc.
As shown in the above figure, our findings included:
We also offered suggestions for how to avoid suboptimal routing that gives rise to such performance degradations post-activation of cables in the future. They could:
To enable reproducibility of this work, we made our tools and publicly accessible on GitHub.
Read the full paper on the CAIDA website or watch the PAM presentation video on YouTube.
The CAIDA annual report summarizes CAIDA’s activities for 2018, in the areas of research, infrastructure, data collection and analysis. Our research projects span Internet topology, routing, security, economics, future Internet architectures, and policy. Our infrastructure, software development, and data sharing activities support measurement-based internet research, both at CAIDA and around the world, with focus on the health and integrity of the global Internet ecosystem. The executive summary is excerpted below:
(more…)
(Forgot to post this earlier, this is old news by now but fwiw..)
I presented at the 10th FTC Hearing on Competition and Consumer Protection in the 21st century this March, held in Washington D.C., giving a talk about Technological Developments in Broadband Networking which aims to address this question: Which (recent and expected) technological developments, or lack thereof, are important for understanding the competitiveness of the industry or impacts on the public interest?
A webcast of the presentation (my talk begins at 10m30s) is available. I also participated in a discussion panel, also webcast.
The CAIDA annual report summarizes CAIDA’s activities for 2017, in the areas of research, infrastructure, data collection and analysis. Our research projects span Internet topology, routing, security, economics, future Internet architectures, and policy. Our infrastructure, software development, and data sharing activities support measurement-based internet research, both at CAIDA and around the world, with focus on the health and integrity of the global Internet ecosystem. The executive summary is excerpted below:
(more…)
Congestion in the Internet is an age-old problem. With the rise of broadband networks, it had been implicitly accepted that congestion is most likely to occur in the ‘last mile’, that is, the broadband link between the ISP and the home customer. This is due to service plans or technical factors that limit the bandwidth in the last mile.
However, two developments have challenged this assumption: the improvement in broadband access speeds, and the exponential growth in video traffic.
Video traffic now consumes a significant fraction of bandwidth even in transit networks, to the extent that interconnection points between major networks can also be potential sources of congestion. A case in point is the widespread interconnection congestion reported between transit network Cogent and several US access ISPs, in 2014.
It is therefore important to understand where congestion occurs—if it occurs in the last mile, then users are limited by their service plan, and if it occurs elsewhere, they are limited by forces outside of their control.
Although there are many TCP forensic tools available, ranging from simple speed tests to more sophisticated diagnostic tools, they do not give information beyond available throughput or that the flow was limited by congestion or other factors such as latency.
Using TCP RTT to distinguish congestion types
In our paper ‘TCP Congestion Signatures‘, which we recently presented at the 2017 Internet Measurement Conference, we developed and validated techniques to identify whether a TCP flow was bottlenecked by:
Our method works without prior knowledge about the path, for example, the capacity of its bottleneck link. As a specific application of this general method, the technique can distinguish congestion experienced on interconnection links from congestion that naturally occurs when a last-mile link is filled to capacity. In TCP terms, we re-articulate the question: was a TCP flow bottlenecked by an already congested (possibly interconnect) link, or did it induce congestion in an otherwise lightly loaded (possibly a last-mile) link?
We use simple intuition based on TCP dynamics to answer this question: TCP’s congestion control mechanism affects the round-trip time (RTT) of packets in the flow. In particular, as TCP scales up to occupy a link that is initially lightly loaded, it gradually fills up the buffer at the head of that link, which in turn increases the flow’s RTT. This effect is most pronounced during the initial slow start period, as the flow throughput increases from zero.
On the contrary, for links that are operating at close to capacity, the buffer at the bottleneck is already occupied, and consequently the new TCP flow’s congestion control does not have a measurable impact on the RTT. In this case, the RTT is more or less constant over the duration of the TCP flow.
We identify two parameters based on flow RTT during TCP slow start that we use to distinguish these two cases: the coefficient of variation and the normalized difference between the minimum and maximum RTT. We feed these two parameters, which can be easily estimated for TCP flows, into a simple decision tree classifier. The figures below shows a simple example of these two metrics for a controlled experiment.
Figure 1. This figure shows the coefficient of variation of packet RTTs during slow start. Flows that are affected by self-induced congestion have higher coefficient of variation than those affected by external congestion.
Figure 2. This figure shows the difference between the maximum and minimum RTT of packets during slow start for flows that are affected by self-induced congestion (blue) and those affected by external congestion (red). Self-induced congestion causes a larger difference in the RTT.
For this experiment we set up an emulated ‘access’ link with a bandwidth of 20 Mbps and 100 ms buffer, and an ‘interconnect’ link of bandwidth 1 Gbps with a 50 ms buffer. We run throughput tests over the links under two conditions: when the interconnect link is busy (it becomes the bottleneck) and when it is not (the access link becomes the bottleneck), and compute the two metrics for the test flows.
The figures show the cumulative distribution function of the two parameters over 50 runs of the experiment. We see that the two cases are clearly distinguishable: both the coefficient of variation and the difference metrics are significantly higher for the case where the access link is the bottleneck.
We validate our techniques using a variety of controlled experiments and real-world datasets, including data from the Measurement Lab platform during and after the interconnection congestion episode between Cogent and various ISPs in early 2014 — for this case we show that the technique distinguishes the two cases of congestion with high accuracy.
Read TCP Congestion Signatures for more details on the experiment.
Uses and Limitations
Our technique distinguishes between self-induced congestion versus externally induced congestion and can be implemented by content providers (for example, video streaming services and speed test providers). The provider would only need to configure the servers to measure the TCP flow during slow start. While we currently use packet captures to extract the metrics we need, we are exploring lighter-weight techniques that require fewer resources.
Implementing such a capability would help a variety of stakeholders. Users would understand more about what limits the performance they experience, content providers could design better solutions to alleviate the effects of congestion, and regulators of the peering ecosystem could rule out consideration of issues where customers are limited by their own contracted service plan.
In terms of limitations, our technique depends on the existence of buffers that influence RTTs, and TCP variants that attempt to fill those buffers. Newer congestion control variants such as BBR that base their congestion management on RTT (and try to reduce buffering delays) may confound the method; we plan to study this, as well as how such congestion control mechanisms interact with older TCP variants, in future work.
Contributors: Amogh Dhamdhere, Mark Allman and kc Claffy
Srikanth Sundaresan’s research interests are in the design and evaluation of networked systems and applications. This work is based on a research paper written when he was at Princeton University. He is currently a software engineer at Facebook.