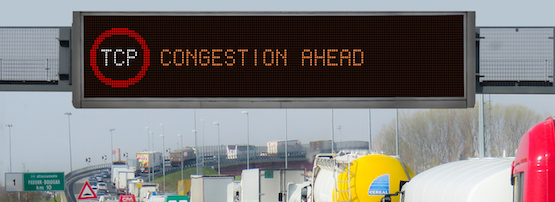
Congestion in the Internet is an age-old problem. With the rise of broadband networks, it had been implicitly accepted that congestion is most likely to occur in the ‘last mile’, that is, the broadband link between the ISP and the home customer. This is due to service plans or technical factors that limit the bandwidth in the last mile.
However, two developments have challenged this assumption: the improvement in broadband access speeds, and the exponential growth in video traffic.
Video traffic now consumes a significant fraction of bandwidth even in transit networks, to the extent that interconnection points between major networks can also be potential sources of congestion. A case in point is the widespread interconnection congestion reported between transit network Cogent and several US access ISPs, in 2014.
It is therefore important to understand where congestion occurs—if it occurs in the last mile, then users are limited by their service plan, and if it occurs elsewhere, they are limited by forces outside of their control.
Although there are many TCP forensic tools available, ranging from simple speed tests to more sophisticated diagnostic tools, they do not give information beyond available throughput or that the flow was limited by congestion or other factors such as latency.
Using TCP RTT to distinguish congestion types
In our paper ‘TCP Congestion Signatures‘, which we recently presented at the 2017 Internet Measurement Conference, we developed and validated techniques to identify whether a TCP flow was bottlenecked by:
- (i) an initially unconstrained path (that the connection then fills), or
- (ii) an already congested path.
Our method works without prior knowledge about the path, for example, the capacity of its bottleneck link. As a specific application of this general method, the technique can distinguish congestion experienced on interconnection links from congestion that naturally occurs when a last-mile link is filled to capacity. In TCP terms, we re-articulate the question: was a TCP flow bottlenecked by an already congested (possibly interconnect) link, or did it induce congestion in an otherwise lightly loaded (possibly a last-mile) link?
We use simple intuition based on TCP dynamics to answer this question: TCP’s congestion control mechanism affects the round-trip time (RTT) of packets in the flow. In particular, as TCP scales up to occupy a link that is initially lightly loaded, it gradually fills up the buffer at the head of that link, which in turn increases the flow’s RTT. This effect is most pronounced during the initial slow start period, as the flow throughput increases from zero.
On the contrary, for links that are operating at close to capacity, the buffer at the bottleneck is already occupied, and consequently the new TCP flow’s congestion control does not have a measurable impact on the RTT. In this case, the RTT is more or less constant over the duration of the TCP flow.
We identify two parameters based on flow RTT during TCP slow start that we use to distinguish these two cases: the coefficient of variation and the normalized difference between the minimum and maximum RTT. We feed these two parameters, which can be easily estimated for TCP flows, into a simple decision tree classifier. The figures below shows a simple example of these two metrics for a controlled experiment.
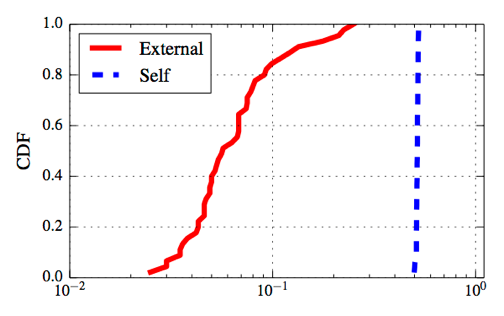
Figure 1. This figure shows the coefficient of variation of packet RTTs during slow start. Flows that are affected by self-induced congestion have higher coefficient of variation than those affected by external congestion.
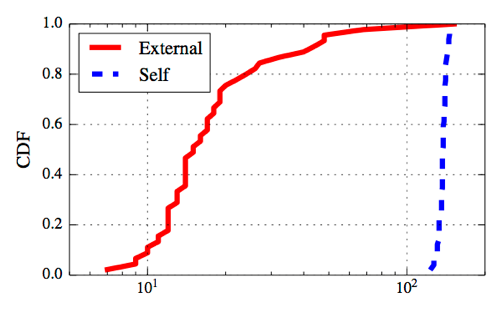
Figure 2. This figure shows the difference between the maximum and minimum RTT of packets during slow start for flows that are affected by self-induced congestion (blue) and those affected by external congestion (red). Self-induced congestion causes a larger difference in the RTT.
For this experiment we set up an emulated ‘access’ link with a bandwidth of 20 Mbps and 100 ms buffer, and an ‘interconnect’ link of bandwidth 1 Gbps with a 50 ms buffer. We run throughput tests over the links under two conditions: when the interconnect link is busy (it becomes the bottleneck) and when it is not (the access link becomes the bottleneck), and compute the two metrics for the test flows.
The figures show the cumulative distribution function of the two parameters over 50 runs of the experiment. We see that the two cases are clearly distinguishable: both the coefficient of variation and the difference metrics are significantly higher for the case where the access link is the bottleneck.
We validate our techniques using a variety of controlled experiments and real-world datasets, including data from the Measurement Lab platform during and after the interconnection congestion episode between Cogent and various ISPs in early 2014 — for this case we show that the technique distinguishes the two cases of congestion with high accuracy.
Read TCP Congestion Signatures for more details on the experiment.
Uses and Limitations
Our technique distinguishes between self-induced congestion versus externally induced congestion and can be implemented by content providers (for example, video streaming services and speed test providers). The provider would only need to configure the servers to measure the TCP flow during slow start. While we currently use packet captures to extract the metrics we need, we are exploring lighter-weight techniques that require fewer resources.
Implementing such a capability would help a variety of stakeholders. Users would understand more about what limits the performance they experience, content providers could design better solutions to alleviate the effects of congestion, and regulators of the peering ecosystem could rule out consideration of issues where customers are limited by their own contracted service plan.
In terms of limitations, our technique depends on the existence of buffers that influence RTTs, and TCP variants that attempt to fill those buffers. Newer congestion control variants such as BBR that base their congestion management on RTT (and try to reduce buffering delays) may confound the method; we plan to study this, as well as how such congestion control mechanisms interact with older TCP variants, in future work.
Contributors: Amogh Dhamdhere, Mark Allman and kc Claffy
Srikanth Sundaresan’s research interests are in the design and evaluation of networked systems and applications. This work is based on a research paper written when he was at Princeton University. He is currently a software engineer at Facebook.