CAIDA’s Annual Report for 2018

May 7th, 2019 by kc

The CAIDA annual report summarizes CAIDA’s activities for 2018, in the areas of research, infrastructure, data collection and analysis. Our research projects span Internet topology, routing, security, economics, future Internet architectures, and policy. Our infrastructure, software development, and data sharing activities support measurement-based internet research, both at CAIDA and around the world, with focus on the health and integrity of the global Internet ecosystem. The executive summary is excerpted below:
Read the rest of this entry »

Technological Developments in Broadband Networking at March FTC Hearing

May 4th, 2019 by kc

(Forgot to post this earlier, this is old news by now but fwiw..)
I presented at the 10th FTC Hearing on Competition and Consumer Protection in the 21st century this March, held in Washington D.C., giving a talk about Technological Developments in Broadband Networking which aims to address this question: Which (recent and expected) technological developments, or lack thereof, are important for understanding the competitiveness of the industry or impacts on the public interest?

A webcast of the presentation (my talk begins at 10m30s) is available. I also participated in a discussion panel, also webcast.

9th Workshop on Internet Economics

January 29th, 2019 by kc

On December 12-13, 2018, CAIDA and the Massachusetts Institute of Technology (MIT) hosted the (invitation-only) 9th interdisciplinary Workshop on Internet Economics (WIE) at the University of California San Diego in La Jolla, CA.

The goal of this workshop series is to provide a forum for researchers, commercial Internet facilities and service providers, technologists, economists, theorists, policy makers, and other stakeholders to empirically inform emerging Internet regulatory and policy debates.

Presenters were asked to write talk abstracts on their presented topics, addressing four questions:

  1. What is the policy goal or fear you’re addressing?
  2. What data is needed to measure progress toward/away from this goal fear?
  3. What methods do you propose (or are) being used to gather such data?
  4. Who/how should such methods be executed, and the data shared, or not shared?

With a specific focus on measurement challenges, the topics we discussed included: analyzing the evolution of the Internet in a layered-platform context to gain new insights; measurement and analysis of economic impacts of new technologies using old tools; security and trustworthiness, reach (universal service) and reachability, sustainability of investment into public Internet infrastructure, as well as infrastructure to measure the public Internet.

Some of the takeaways from the workshop included:
Read the rest of this entry »

Announcing public access to CAIDA’s platform for Measurement and Analysis of Interdomain Congestion (MANIC)

December 19th, 2018 by Roderick Fanou, Amogh Dhamdhere and kc

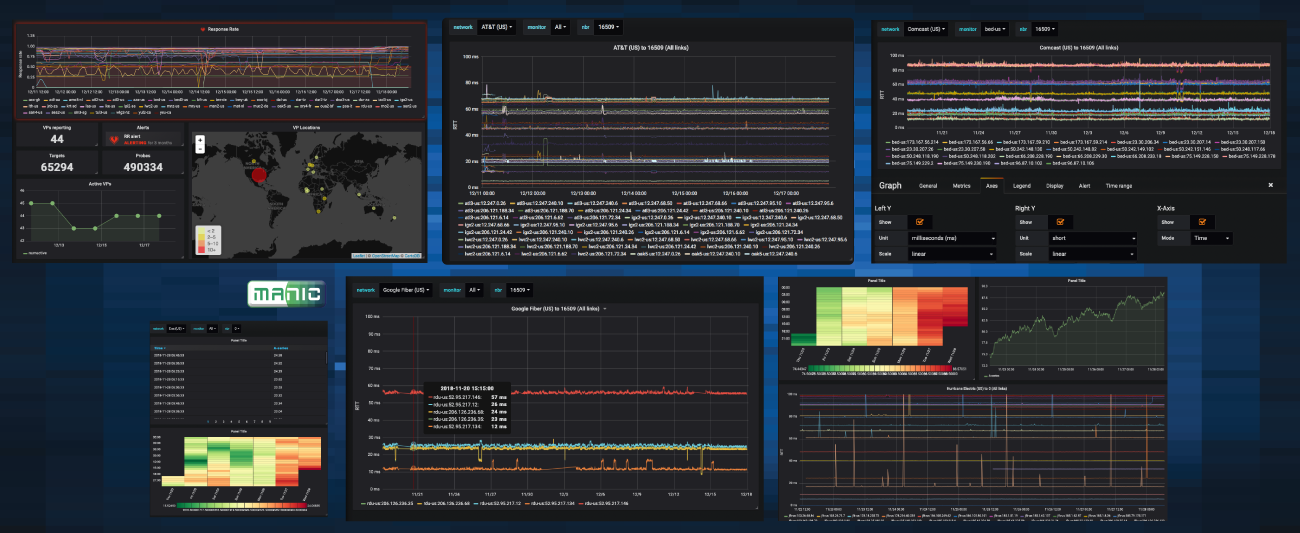
Presented at our 10th AIMS Workshop earlier this year, the MANIC project resulted in a prototype system to monitor interdomain links and their congestion state to support inference of persistent interdomain congestion. We announce the release of web and API-based methods to access the data. MANIC provides both a graphical user interface for conducting queries and visualizing results and programmatic access to the measurements via a queryable API. We used this MANIC infrastructure and data in our recent publication of “Inferring Persistent Interdomain Congestion”, which won the best paper award at ACM SIGCOMM 2018.

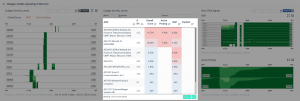
                                                       MANIC dashboard screenshot examples.

Excerpted from the paper:

“(4) We are publicly releasing our analysis scripts, and the underlying datasets via an interactive visualization interface and query API to encourage reproducibility of our results. Our data management system, based on the InfluxDB time-series database and Grafana visualization front-end, allows interactive data exploration, near real-time views of interdomain links, and longitudinal views. While this paper focuses on data from U.S. broadband access providers, we are publicly releasing measurements from VPs outside the U.S. as well.”

For access to the MANIC dashboard, or questions about the publicly accessible API, please contact manic-info@caida.org. (It is a beta prototype, in progress!)


Support for this work is provided by the National Science Foundation (NSF) grants NSF CNS-1414177, NSF OAC-1724853, NSF CNS-1513283, and Department of Homeland Security S&T HHSP 233201600012C and FA8750-18-2-0049.


CAIDA wins Best Paper at ACM SIGCOMM 2018!

August 22nd, 2018 by CAIDA Webmaster

Congratulations to Amogh Dhamdhere, David Clark, Alexander Gamero-Garrido, Matthew Luckie, Ricky K.P. Mok, Gautam Akiwate, Kabir Gogia, Vaibhav Bajpai, Alex Snoeren, and kc claffy, for being awarded Best Paper at SIGCOMM 2018!

The abstract from the paper, “Inferring Persistent Interdomain Congestion“:

There is significant interest in the technical and policy communities regarding the extent,scope, and consumer harm of persistent interdomain congestion. We provide empirical grounding for discussions of interdomain congestion by developing a system and method to measure congestion on thousands of interdomain links without direct access to them. We implement a system based on the Time Series Latency Probes (TSLP) technique that identifies links with evidence of recurring congestion suggestive of an under-provisioned link. We deploy our system at 86 vantage points worldwide and show that congestion inferred using our lightweight TSLP method correlates with other metrics of interconnection performance impairment. We use our method to study interdomain links of eight large U.S. broadband access providers from March 2016 to December 2017, and validate our inferences against ground-truth traffic statistics from two of the providers. For the period of time over which we gathered measurements, we did not find evidence of widespread endemic congestion on interdomain links between access ISPs and directly connected transit and content providers, although some such links exhibited recurring congestion patterns. We describe limitations, open challenges, and a path toward the use of this method for large-scale third-party monitoring of the Internet interconnection ecosystem.

Read the full paper on the CAIDA website.

IODA is now on Twitter

August 6th, 2018 by Philipp Winter

Detecting Internet outages world-wide and in real-time is no small feat. It requires distributed measurement infrastructure, tools and processing power to analyze the resulting data, plenty of storage to save it, and a powerful user interface to visualize the data. IODA (short for Internet Outage Detection and Analysis) is CAIDA’s solution to this problem.

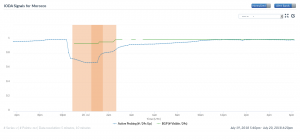
In an attempt to make IODA more useful, we just launched @caida_ioda, a Twitter account to bring attention to select Internet outages. We inaugurated this account by revealing an outage that took place in Morocco, on July 19, from 11:30 pm to 3:50 am local time. The visualization below illustrates this outage. The blue time series represents our active probing data. This data comes from a cluster of twenty software instances, located at SDSC in San Diego, that repeatedly ping active hosts in the IPv4 address space. Each data point of the time series captures the normalized number of /24 network blocks in Morocco that responded to these pings. The data is normalized with respect to the maximum value observed in the inspected time interval. Starting at 10:20 pm UTC, this fraction dropped significantly (from ~19,700 /24 network blocks to as low as ~13,400) and slowly started to recover after a few hours. The green time series exhibits a drop at the same time—it represents the normalized number of /24 network blocks that are reachable according to BGP, and geolocated to Morocco. The gaps in the BGP time series are due to missing data points caused by temporary issues with our infrastructure. You can use our interactive dashboard to investigate this outage yourself.

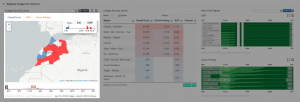
Internet outages do not always affect entire countries; their scope is frequently limited to regions or autonomous systems (ASes). IODA can detect such sub-national outages and, coming back to our example, did so for Morocco. The map below suggests that not all of the country’s regions were affected equally. Note, however, that IP address geolocation (that is, the mapping from IP address to geographical location) is far from perfect, so take this information with a grain of salt.

IODA determines an anomaly score for each outage that it detects. Our help page provides more details on how we determine this score but in essence it’s a number that captures the severity of the outage. A look at IODA’s AS-level breakdown confirms that Maroc Telecom was affected the most—the ISP’s overall anomaly score is more than twice that of Itissalat Al-Maghrib, the ISP that ranked second.

So, what happened? IODA reveals where Internet outages happen but it cannot tell us why. Understanding an outage’s root cause still requires a human in the loop; mostly to read news reports and social media postings that mention the outage. In our example, a search of the Arabic-speaking part of the Internet for “morocco internet” led us to Maroc Telecom’s Facebook page, which cited a power outage as the cause:

The time span quoted by Maroc Telecom roughly confirms what IODA saw but our data suggests that the outage began earlier—our active probers first saw a decline in connectivity at 11:30 pm—about half an hour before the alleged start of the outage.

We are supporting public access to IODA’s dashboard for exploration of this and other outages; please use it and send feedback to ioda-info AT caida DOT org.

IPv6 adoption as seen from an Internet backbone link

May 29th, 2018 by Paul Hick and Josh Polterock

For the last ten years (with some gaps due to network upgrades), CAIDA has captured monthly traffic samples on Internet backbone links in several large U.S[ cities (San Jose, Chicago, and since March this year, New York City).
We publish statistics for these traces at http://www.caida.org/data/passive/trace_stats/, which illustrates the growth in IPv6 traffic, relative to IPv4. Over the 10-year period covered by our traffic captures, the increase follows a steady exponential trend (linear on a log-lin graph), increasing 10-fold every 3 years. Currently the IPv6 fraction hovers around 1%. Were this trend to continue, the ratios would be roughly 50% each around October 2022 (for packets) September 2023 (for bytes). The byte fraction increases more slowly, reflecting a slightly smaller average IPv6 packet size compared to IPv4.

IPv6 Traffic Seen on a Backbone Link

We are not making any predictions, and note that CGN deployment is also increasing rapidly. We are just reporting the best available data we have.

CAIDA’s Program Plan 2018-2023

May 29th, 2018 by kc

We finally published our new Program Plan for 2018-2023. (Previous program plans are at http://www.caida.org/home/about/progplan.) Executive summary below:

For the last 20 years UC San Diego’s Center for Applied Internet Data Analysis (CAIDA) has been developing data-focused services, products, tools and resources to advance the study of the Internet, which has permeated disciplines ranging from theoretical computer science to political science, from physics to tech law, and from network architecture to public policy. As the Internet and our dependence on it have grown, the structure and dynamics of the network, and how it relates to the political economy in which it is embedded, is gathering increasing attention by researchers, operators and policy makers, all of whom bring questions that they lack the capability to answer themselves. CAIDA has spent years cultivating relationships across disciplines (networking, security, economics, law, policy) with those interested in CAIDA data, but the impact thus far has been limited to a handful of researchers. The current mode of collaboration simply does not scale to the exploding interest in scientific study of the Internet.

On a more operational dimension, large-scale Internet cyber-attacks and incidents — route hijacking, network outages, fishing campaigns, botnet activities, large-scale bug exploitation, etc. — represent a major threat to public safety and to both public and private strategic and financial assets. Mitigation and recovery, as well as prevention of further attacks of similar nature, are often impeded by the fact that such events can remain unnoticed or are hard to understand and characterize. Because of their macroscopic nature, identifying such events and understanding their scope and dynamics requires: (a) combining data of different type and origin; and (b) teamwork of experts with varied background and skills; (c) agile tools for rapid, cooperative, interactive analysis.

These two infrastructure research challenges will require high performance research infrastructure, and CAIDA will embark on a new stage in our infrastructure development endeavors to support these challenges, re-using and sharing software and data components wherever possible. We will integrate existing as well as develop new measurement and analysis components and capabilities into interactive online platforms, accessible via web interfaces as well as APIs. These novel developments will enable researchers from various disciplines including non-networking experts to access and productively use Internet data, thus advancing more complex and visionary scientific studies of the Internet ecosystem. We hope these efforts will enable us and others to widen access to and utility of the best possible Internet measurement data available to research, operational, and policy communities worldwide.

On the research side, we will continue our Internet cartography efforts, improving our IPv4 and IPv6 topology mapping capabilities, and our ability to measure and analyze interdomain congestion. We will also continue development our of Internet Topology Data Kit (ITDK) data sets, but shift our focus to simplified versions of the data and visual interfaces that are easier for researchers to use. We will undertake a new project that studies topological weaknesses from a nation-state security and stability perspective. We will explore implications of these analysis for network resiliency, economics, and policy. Among our new collaborations is an interdisciplinary project to model and design an ecosystem for market-mediated software defined communications infrastructure at the wireless edge. And in the intersection between research and infrastructure, we will start a new research project that explores an ambitious new way of designing measurement infrastructure platforms to facilitate broader deployment and sharing of nodes across scientific experimenters.

As always, we will lead and participate in tool development to support measurement, analysis, indexing, and dissemination of data from operational global Internet infrastructure. Our outreach activities will include peer-reviewed papers, workshops, blogging, presentations, educational videos, and technical reports.

Note that not all of the activities described in this program plan are fully funded yet; we are seeking additional support to enable us to accomplish our ambitious agenda.


Complete program plan for 2018-2023 at: http://www.caida.org/home/about/progplan/progplan2018/.

CAIDA’s Annual Report for 2017

May 29th, 2018 by kc

The CAIDA annual report summarizes CAIDA’s activities for 2017, in the areas of research, infrastructure, data collection and analysis. Our research projects span Internet topology, routing, security, economics, future Internet architectures, and policy. Our infrastructure, software development, and data sharing activities support measurement-based internet research, both at CAIDA and around the world, with focus on the health and integrity of the global Internet ecosystem. The executive summary is excerpted below:
Read the rest of this entry »

TCP Congestion Signatures

February 6th, 2018 by Srikanth Sundaresan

Roadsign: TCP Congestion Ahead

Congestion in the Internet is an age-old problem. With the rise of broadband networks, it had been implicitly accepted that congestion is most likely to occur in the ‘last mile’, that is, the broadband link between the ISP and the home customer. This is due to service plans or technical factors that limit the bandwidth in the last mile.

However, two developments have challenged this assumption: the improvement in broadband access speeds, and the exponential growth in video traffic.

Video traffic now consumes a significant fraction of bandwidth even in transit networks, to the extent that interconnection points between major networks can also be potential sources of congestion. A case in point is the widespread interconnection congestion reported between transit network Cogent and several US access ISPs, in 2014.

It is therefore important to understand where congestion occurs—if it occurs in the last mile, then users are limited by their service plan, and if it occurs elsewhere, they are limited by forces outside of their control.

Although there are many TCP forensic tools available, ranging from simple speed tests to more sophisticated diagnostic tools, they do not give information beyond available throughput or that the flow was limited by congestion or other factors such as latency.

Using TCP RTT to distinguish congestion types

In our paper ‘TCP Congestion Signatures‘, which we recently presented at the 2017 Internet Measurement Conference, we developed and validated techniques to identify whether a TCP flow was bottlenecked by:

  • (i) an initially unconstrained path (that the connection then fills), or
  • (ii) an already congested path.

Our method works without prior knowledge about the path, for example, the capacity of its bottleneck link. As a specific application of this general method, the technique can distinguish congestion experienced on interconnection links from congestion that naturally occurs when a last-mile link is filled to capacity. In TCP terms, we re-articulate the question: was a TCP flow bottlenecked by an already congested (possibly interconnect) link, or did it induce congestion in an otherwise lightly loaded (possibly a last-mile) link?

We use simple intuition based on TCP dynamics to answer this question: TCP’s congestion control mechanism affects the round-trip time (RTT) of packets in the flow. In particular, as TCP scales up to occupy a link that is initially lightly loaded, it gradually fills up the buffer at the head of that link, which in turn increases the flow’s RTT. This effect is most pronounced during the initial slow start period, as the flow throughput increases from zero.

On the contrary, for links that are operating at close to capacity, the buffer at the bottleneck is already occupied, and consequently the new TCP flow’s congestion control does not have a measurable impact on the RTT. In this case, the RTT is more or less constant over the duration of the TCP flow.

We identify two parameters based on flow RTT during TCP slow start that we use to distinguish these two cases: the coefficient of variation and the normalized difference between the minimum and maximum RTT. We feed these two parameters, which can be easily estimated for TCP flows, into a simple decision tree classifier. The figures below shows a simple example of these two metrics for a controlled experiment.

Graph

Figure 1. This figure shows the coefficient of variation of packet RTTs during slow start. Flows that are affected by self-induced congestion have higher coefficient of variation than those affected by external congestion.

Graph

Figure 2. This figure shows the difference between the maximum and minimum RTT of packets during slow start for flows that are affected by self-induced congestion (blue) and those affected by external congestion (red). Self-induced congestion causes a larger difference in the RTT.

For this experiment we set up an emulated ‘access’ link with a bandwidth of 20 Mbps and 100 ms buffer, and an ‘interconnect’ link of bandwidth 1 Gbps with a 50 ms buffer. We run throughput tests over the links under two conditions: when the interconnect link is busy (it becomes the bottleneck) and when it is not (the access link becomes the bottleneck), and compute the two metrics for the test flows.

The figures show the cumulative distribution function of the two parameters over 50 runs of the experiment. We see that the two cases are clearly distinguishable: both the coefficient of variation and the difference metrics are significantly higher for the case where the access link is the bottleneck.

We validate our techniques using a variety of controlled experiments and real-world datasets, including data from the Measurement Lab platform during and after the interconnection congestion episode between Cogent and various ISPs in early 2014 — for this case we show that the technique distinguishes the two cases of congestion with high accuracy.

Read TCP Congestion Signatures for more details on the experiment.

Uses and Limitations

Our technique distinguishes between self-induced congestion versus externally induced congestion and can be implemented by content providers (for example, video streaming services and speed test providers). The provider would only need to configure the servers to measure the TCP flow during slow start. While we currently use packet captures to extract the metrics we need, we are exploring lighter-weight techniques that require fewer resources.

Implementing such a capability would help a variety of stakeholders. Users would understand more about what limits the performance they experience, content providers could design better solutions to alleviate the effects of congestion, and regulators of the peering ecosystem could rule out consideration of issues where customers are limited by their own contracted service plan.

In terms of limitations, our technique depends on the existence of buffers that influence RTTs, and TCP variants that attempt to fill those buffers. Newer congestion control variants such as BBR that base their congestion management on RTT (and try to reduce buffering delays) may confound the method; we plan to study this, as well as how such congestion control mechanisms interact with older TCP variants, in future work.

Contributors: Amogh Dhamdhere, Mark Allman and kc Claffy

Srikanth Sundaresan’s research interests are in the design and evaluation of networked systems and applications. This work is based on a research paper written when he was at Princeton University. He is currently a software engineer at Facebook.