Archive for the 'Visualization' Category

AS Reachability Visualization

Wednesday, December 4th, 2024 by Bradley Huffaker

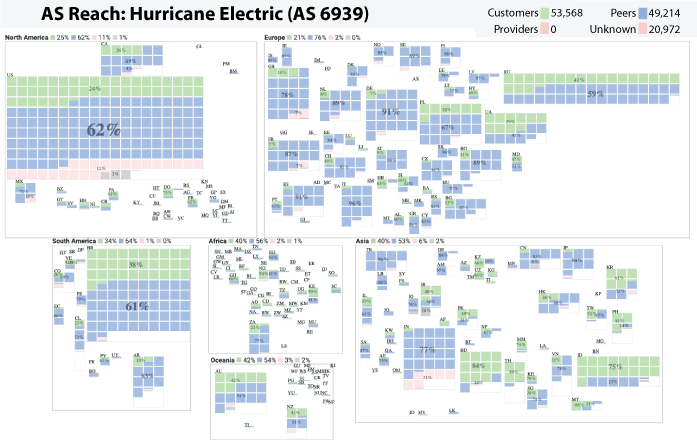
The AS Reach Visualization provides a geographic breakdown of the number of ASes reachable through an AS’s customer, peers, providers, or an unknown neighbor. The interactive interface to the visualization can be found at https://www.caida.org/catalog/media/visualizations/as-reach/

Independent networks (Autonomous Systems, or ASes) engage in typically voluntary bilateral interconnection (“peering”) agreements to provide reachability to each other for some subset of the Internet. The implementation of these agreements introduces a non-trivial set of constraints regarding paths over which Internet traffic can flow, with implications for network operations, research, and evolution. Realistic models of Internet topology, routing, workload, and performance
must account for the underlying economic dynamics.

Although these business agreements between ISPs can be complicated, the original model introduced by Gao (On inferring autonomous system relationships in the Internet), abstracts business relationships into the following three most common types:

  • customer-to provider: in which a customer network gets access to the internet from a provider network
  • provider-to-customer: the reverse of the customer-to-provider, the provider provides access to it’s customer
  • peer-to-peer: where both ASes exchange traffic between their customers

An AS’s Reach is defined as the set of ASes the target AS can reach through its customers, peers, providers, or unknown. The Customer Reach is the set of ASes reachable through the AS’s customers. The Peer Reach is the set of ASes that are not in the Customer Reach, but reachable through the AS’s peers. The Provider Reach is the set of ASes not in the Customer or Peer Reach, but reachable through the AS’s provider. The Unknown Reach is the set of ASes not in the Customer, Peer, or Provider Reach. More details at https://www.caida.org/catalog/media/visualizations/as-reach/

CAIDA’s 2023 Annual Report

Wednesday, October 23rd, 2024 by kc

The CAIDA annual report (quite a bit later than usual this year due to an unprecedented level of activity in 2024 which we will report on earlier next year!) summarizes CAIDA’s activities for 2023 in the areas of research, infrastructure, data collection and analysis. The executive summary is excerpted below:
(more…)

CAIDA’s 2022 Annual Report

Monday, July 10th, 2023 by kc

The CAIDA annual report summarizes CAIDA’s activities for 2022 in the areas of research, infrastructure, data collection and analysis. The executive summary is excerpted below:
(more…)

IPv4 History Visualization

Thursday, August 6th, 2020 by Nicole Lee

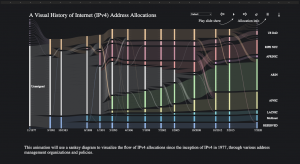
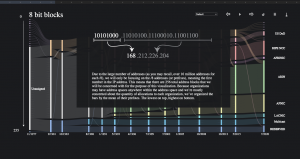
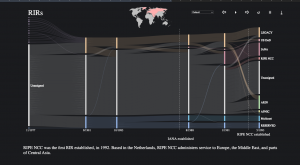
This visualization shows how the growing demand for those addresses transformed the governance model from a handful of scientists and engineers managing these addresses to the multi-stakeholder governance model we have today. IPv4 (the fourth version of the Internet Protocol) is the governing standard of today’s Internet. Similar to any other network, unique identifiers play an integral role in Internet routing. We group IP address blocks based on the organization that regulates its allocation as recorded in IANA’s IPv4 address space file and the RFC.

Please view the visualization at: https://www.caida.org/publications/visualizations/ipv4-history/

Screenshots of the visualization


This was created with the support of the National Science Foundation (NSF). For any questions or comments on this project, please contact info@caida.org.

CAIDA’s Annual Report for 2018

Tuesday, May 7th, 2019 by kc

The CAIDA annual report summarizes CAIDA’s activities for 2018, in the areas of research, infrastructure, data collection and analysis. Our research projects span Internet topology, routing, security, economics, future Internet architectures, and policy. Our infrastructure, software development, and data sharing activities support measurement-based internet research, both at CAIDA and around the world, with focus on the health and integrity of the global Internet ecosystem. The executive summary is excerpted below:
(more…)

IODA is now on Twitter

Monday, August 6th, 2018 by Philipp Winter

Detecting Internet outages world-wide and in real-time is no small feat. It requires distributed measurement infrastructure, tools and processing power to analyze the resulting data, plenty of storage to save it, and a powerful user interface to visualize the data. IODA (short for Internet Outage Detection and Analysis) is CAIDA’s solution to this problem.

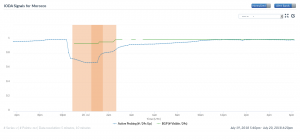
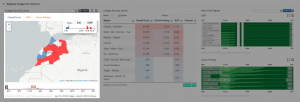
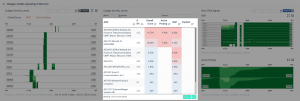
In an attempt to make IODA more useful, we just launched @caida_ioda, a Twitter account to bring attention to select Internet outages. We inaugurated this account by revealing an outage that took place in Morocco, on July 19, from 11:30 pm to 3:50 am local time. The visualization below illustrates this outage. The blue time series represents our active probing data. This data comes from a cluster of twenty software instances, located at SDSC in San Diego, that repeatedly ping active hosts in the IPv4 address space. Each data point of the time series captures the normalized number of /24 network blocks in Morocco that responded to these pings. The data is normalized with respect to the maximum value observed in the inspected time interval. Starting at 10:20 pm UTC, this fraction dropped significantly (from ~19,700 /24 network blocks to as low as ~13,400) and slowly started to recover after a few hours. The green time series exhibits a drop at the same time—it represents the normalized number of /24 network blocks that are reachable according to BGP, and geolocated to Morocco. The gaps in the BGP time series are due to missing data points caused by temporary issues with our infrastructure. You can use our interactive dashboard to investigate this outage yourself.

Internet outages do not always affect entire countries; their scope is frequently limited to regions or autonomous systems (ASes). IODA can detect such sub-national outages and, coming back to our example, did so for Morocco. The map below suggests that not all of the country’s regions were affected equally. Note, however, that IP address geolocation (that is, the mapping from IP address to geographical location) is far from perfect, so take this information with a grain of salt.

IODA determines an anomaly score for each outage that it detects. Our help page provides more details on how we determine this score but in essence it’s a number that captures the severity of the outage. A look at IODA’s AS-level breakdown confirms that Maroc Telecom was affected the most—the ISP’s overall anomaly score is more than twice that of Itissalat Al-Maghrib, the ISP that ranked second.

So, what happened? IODA reveals where Internet outages happen but it cannot tell us why. Understanding an outage’s root cause still requires a human in the loop; mostly to read news reports and social media postings that mention the outage. In our example, a search of the Arabic-speaking part of the Internet for “morocco internet” led us to Maroc Telecom’s Facebook page, which cited a power outage as the cause:

The time span quoted by Maroc Telecom roughly confirms what IODA saw but our data suggests that the outage began earlier—our active probers first saw a decline in connectivity at 11:30 pm—about half an hour before the alleged start of the outage.

We are supporting public access to IODA’s dashboard for exploration of this and other outages; please use it and send feedback to ioda-info AT caida DOT org.

CAIDA’s Annual Report for 2017

Tuesday, May 29th, 2018 by kc

The CAIDA annual report summarizes CAIDA’s activities for 2017, in the areas of research, infrastructure, data collection and analysis. Our research projects span Internet topology, routing, security, economics, future Internet architectures, and policy. Our infrastructure, software development, and data sharing activities support measurement-based internet research, both at CAIDA and around the world, with focus on the health and integrity of the global Internet ecosystem. The executive summary is excerpted below:
(more…)

CAIDA’s 2016 Annual Report

Tuesday, May 9th, 2017 by kc

[Executive summary and link below]

The CAIDA annual report summarizes CAIDA’s activities for 2016, in the areas of research, infrastructure, data collection and analysis. Our research projects span Internet topology, routing, security, economics, future Internet architectures, and policy. Our infrastructure, software development, and data sharing activities support measurement-based internet research, both at CAIDA and around the world, with focus on the health and integrity of the global Internet ecosystem. The executive summary is excerpted below:

Mapping the Internet. We continued to expand our topology mapping capabilities using our Ark measurement infrastructure. We improved the accuracy and sophistication of our topology annotations, including classification of ISPs, business relationships between them, and geographic mapping of interdomain links that implement these relationships. We released two Internet Topology Data Kits (ITDKs) incorporating these advances.

Mapping Interconnection Connectivity and Congestion. We continued our collaboration with MIT to map the rich mesh of interconnection in the Internet in order to study congestion induced by evolving peering and traffic management practices of CDNs and access ISPs. We focused our efforts on the challenge of detecting and localizing congestion to specific points in between networks. We developed new tools to scale measurements to a much wider set of available nodes. We also implemented a new database and graphing platform to allow us to interactively explore our topology and performance measurements. We produced related data collection and analyses to enable evaluation of these measurements in the larger context of the evolving ecosystem: infrastructure resiliency, economic tussles, and public policy.

Monitoring Global Internet Security and Stability. We conducted infrastructure research and development projects that focus on security and stability aspects of the global Internet. We developed continuous fine-grained monitoring capabilities establishing a baseline connectivity awareness against which to interpret observed changes due to network outages or route hijacks. We released (in beta form) a new operational prototype service that monitors the Internet, in near-real-time, and helps identify macroscopic Internet outages affecting the edge of the network.

CAIDA also developed new client tools for measuring IPv4 and IPv6 spoofing capabilities, along with services that provide reporting and allow users to opt-in or out of sharing the data publicly.

Future Internet Architectures. We continued studies of IPv4 and IPv6 paths in the Internet, including topological congruency, stability, and RTT performance. We examined the state of security policies in IPv6 networks, and collaborated to measure CGN deployment in U.S. broadband networks. We also continued our collaboration with researchers at several other universities to advance development of a new Internet architecture: Named Data Networking (NDN) and published a paper on the policy and social implications of an NDN-based Internet.

Public Policy. Acting as an Independent Measurement Expert, we posted our agreed-upon revised methodology for measurement methods and reporting requirements related to AT&T Inc. and DirecTV merger (MB Docket No. 14-90). We published our proposed method and a companion justification document. Inspired by this experience and a range of contradicting claims about interconnection performance, we introduced a new model describing measurements of interconnection links of access providers, and demonstrated how it can guide sound interpretation of interconnection-related measurements regardless of their source.

Infrastructure operations. It was an unprecedented year for CAIDA from an infrastructure development perspective. We continued support for our existing active and passive measurement infrastructure to provide visibility into global Internet behavior, and associated software tools and platforms that facilitate network research and operational assessments.

We made available several data services that have been years in the making: our prototype Internet Outage Detection and Analysis service, with several underlying components released as open source; the Periscope platform to unify and scale querying of thousands of looking glass nodes on the global Internet; our large-scale Internet topology query system (Henya); and our Spoofer system for measurement and analysis of source address validation across the global Internet. Unfortunately, due to continual network upgrades, we lost access to our 10GB backbone traffic monitoring infrastructure. Now we are considering approaches to acquire new monitors capable of packet capture on 100GB links.

As always, we engaged in a variety of tool development, and outreach activities, including maintaining web sites, publishing 13 peer-reviewed papers, 3 technical reports, 4 workshop reports, one (our first) BGP hackathon report, 31 presentations, 20 blog entries, and hosting 6 workshops (including the hackathon). This report summarizes the status of our activities; details about our research are available in papers, presentations, and interactive resources on our web sites. We also provide listings and links to software tools and data sets shared, and statistics reflecting their usage. Finally, we report on web site usage, personnel, and financial information, to provide the public a better idea of what CAIDA is and does.

For the full 2016 annual report, see http://www.caida.org/home/about/annualreports/2016/
Henya: Large-Scale Internet Topology Query System

Saturday, December 17th, 2016 by Josh Polterock

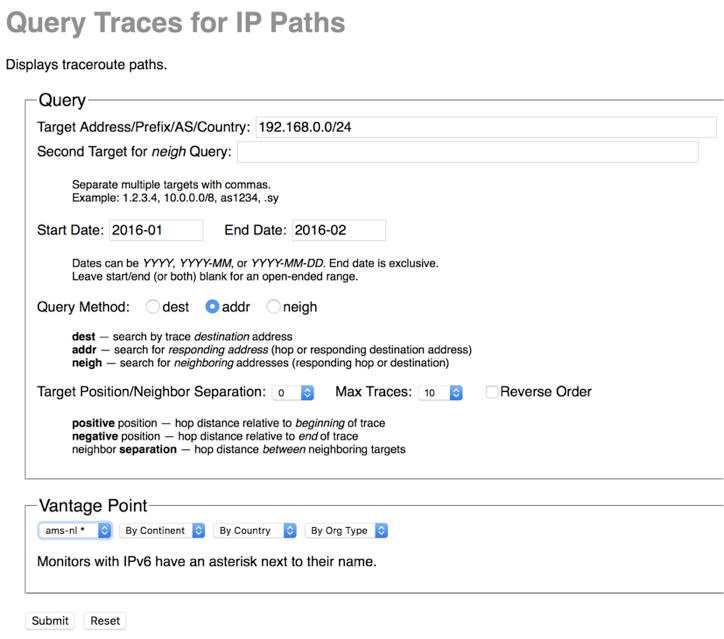
CAIDA’s Internet topology mapping experiment running on our Ark infrastructure has collected traceroute-like measurements of the Internet from nodes hosted in academic, commercial, transit, and residential networks around the globe since September 2007. Discovery of the full potential value of this raw data is best served by a rich, easy-to-use interactive exploratory interface. We have implemented a web-based query interface — henya — to allow researchers to find the most relevant data for their research, such as all traceroutes through a given region and time period toward/across a particular prefix/AS.

We hope that Henya’s large-scale topology query system will become a powerful tool in the researcher’s toolbox for remotely searching CAIDA’s traceroute data. Built-in analysis and visualization modules (still under development) will facilitate our understanding of route and prefix hijacking events as well as provide us with the means to conduct longitudinal analysis. Below we show a screenshot of Henya’s query interface, but Young Hyun, Henya’s creator, also created a useful short introduction video.

henya-query

(A note about the name Henya: Jeju, an island off the coast of South Korea, has a long history of free diving. Over the past few centuries, skilled women divers called haenyeo (pronounced “HEN-yuh”, literally “sea women”) earned their living harvesting and selling various sea-life. Highly-trained haenyeo can dive up to 30 meters deep and can hold their breath for over three minutes. Through this tiring and dangerous work, these women became the breadwinners of their families. Sadly the tradition has nearly died out, with only a few thousand practitioners left, nearly all of the them elderly. Free diving is an inspiring metaphor for data querying, and we thought this name would serve to honor this dying tradition by preserving the name in the topo-query system.)

The work was funded by the Department of Homeland Security (DHS) Science and Technology Directorate, Cyber Security Division DHS S&T/CSD) Broad Agency Announcement 11-02 and SPAWAR Systems Center Pacific via contract number N66001-12-C-0130, and by Research and Development Canada (DRDC) pursuant to an Agreement between the U.S. and Canadian governments for Cooperation in and Technology for Critical Infrastructure Protection and Border Security. The work represents the position of the authors and necessarily that of DHS or DRDC.

The Remote Peering Jedi

Friday, November 11th, 2016 by Josh Polterock

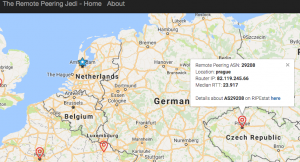
During the RIPE 73 IXP Tools Hackathon, Vasileios Giotsas, working with collaborators at FORTH/University of Crete, AMS-IX, University College, London, and NFT Consult, created the Remote Peering Jedi Tool to provide a view into the remote peering ecosystem. Given a large and diverse corpus of traceroute data, the tool detects and localizes remote peering at Internet Exchange Points (IXP).

To make informed decisions, researchers and operators desire to know who has remote peering at the various IXPs. For their RIPE hackathon project, the group created a tool to automate the detection using average RTTs from the RIPE Atlas’ massive corpus of traceroute paths. The group collected validation data from boxes inside the three large IXPs to compare to RTTs estimated via Atlas. The data suggests possible opportunities for Content Distribution Networks (CDN) to improve services for smaller IXPs. The project results also offer insights into how to interpret some of the information in PeeringDB. The project further examined how presence-informed RTT geolocation can contribute to identifying the location of resources. These results help reduce the problem space by exploiting the fact that the IP space of a given AS can appear where the AS has presence.

For more details, you can watch Vasileios’ presentation of the Remote Peering Jedi Tool. Or, visit the remote peering portal to see the tool in action.

remote-peering-jedi