CAIDA’s 2015 Annual Report
Tuesday, July 19th, 2016 by kc[Executive summary and link below]
The CAIDA annual report summarizes CAIDA’s activities for 2015, in the areas of research, infrastructure, data collection and analysis. Our research projects span Internet topology, routing, security, economics, future Internet architectures, and policy. Our infrastructure, software development, and data sharing activities support measurement-based internet research, both at CAIDA and around the world, with focus on the health and integrity of the global Internet ecosystem. The executive summary is excerpted below:
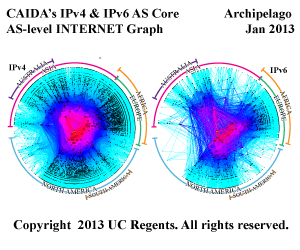
Mapping the Internet. We continued to pursue Internet cartography, improving our IPv4 and IPv6 topology mapping capabilities using our expanding and extensible Ark measurement infrastructure. We improved the accuracy and sophistication of our topology annotation capabilities, including classification of ISPs and their business relationships. Using our evolving IP address alias resolution measurement system, we collected curated, and released another Internet Topology Data Kit (ITDK).
Mapping Interconnection Connectivity and Congestion. We used the Ark infrastructure to support an ambitious collaboration with MIT to map the rich mesh of interconnection in the Internet, with a focus on congestion induced by evolving peering and traffic management practices of CDNs and access ISPs, including methods to detect and localize the congestion to specific points in networks. We undertook several studies to pursue different dimensions of this challenge: identification of interconnection borders from comprehensive measurements of the global Internet topology; identification of the actual physical location (facility) of an interconnection in specific circumstances; and mapping observed evidence of congestion at points of interconnection. We continued producing other related data collection and analysis to enable evaluation of these measurements in the larger context of the evolving ecosystem: quantifying a given ISP’s global routing footprint; classification of autonomous systems (ASes) according to business type; and mapping ASes to their owning organizations. In parallel, we examined the peering ecosystem from an economic perspective, exploring fundamental weaknesses and systemic problems of the currently deployed economic framework of Internet interconnection that will continue to cause peering disputes between ASes.Monitoring Global Internet Security and Stability. We conduct other global monitoring projects, which focus on security and stability aspects of the global Internet: traffic interception events (hijacks), macroscopic outages, and network filtering of spoofed packets. Each of these projects leverages the existing Ark infrastructure, but each has also required the development of new measurement and data aggregation and analysis tools and infrastructure, now at various stages of development. We were tremendously excited to finally finish and release BGPstream, a software framework for processing large amounts of historical and live BGP measurement data. BGPstream serves as one of several data analysis components of our outage-detection monitoring infrastructure, a prototype of which was operating at the end of the year. We published four other papers that either use or leverage the results of internet scanning and other unsolicited traffic to infer macroscopic properties of the Internet.
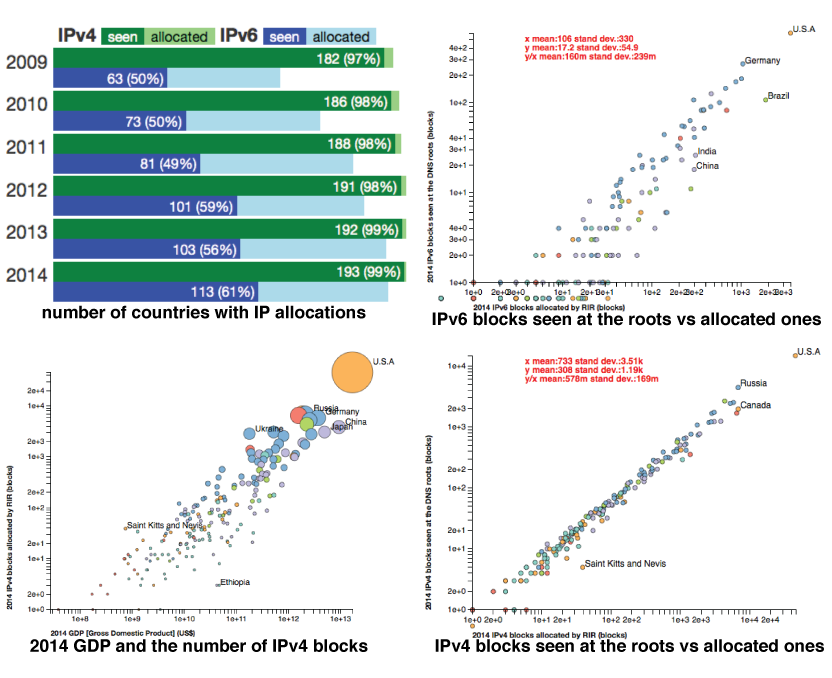
Future Internet Architectures. The current TCP/IP architecture is showing its age, and the slow uptake of its ostensible upgrade, IPv6, has inspired NSF and other research funding agencies around the world to invest in research on entirely new Internet architectures. We continue to help launch this moonshot from several angles — routing, security, testbed, management — while also pursuing and publishing results of six empirical studies of IPv6 deployment and evolution.
Public Policy. Our final research thrust is public policy, an area that expanded in 2015, due to requests from policymakers for empirical research results or guidance to inform industry tussles and telecommunication policies. Most notably, the FCC and AT&T selected CAIDA to be the Independent Measurement Expert in the context of the AT&T/DirecTV merger, which turned out to be as much of a challenge as it was an honor. We also published three position papers each aimed at optimizing different public policy outcomes in the face of a rapidly evolving information and communication technology landscape. We contributed to the development of frameworks for ethical assessment of Internet measurement research methods.
Our infrastructure operations activities also grew this year. We continued to operate active and passive measurement infrastructure with visibility into global Internet behavior, and associated software tools that facilitate network research and security vulnerability analysis. In addition to BGPstream, we expanded our infrastructure activities to include a client-server system for allowing measurement of compliance with BCP38 (ingress filtering best practices) across government, research, and commercial networks, and analysis of resulting data in support of compliance efforts. Our 2014 efforts to expand our data sharing efforts by making older topology and some traffic data sets public have dramatically increased use of our data, reflected in our data sharing statistics. In addition, we were happy to help launch DHS’ new IMPACT data sharing initiative toward the end of the year.
Finally, as always, we engaged in a variety of tool development, and outreach activities, including maintaining web sites, publishing 27 peer-reviewed papers, 3 technical reports, 3 workshop reports, 33 presentations, 14 blog entries, and hosting 5 workshops. This report summarizes the status of our activities; details about our research are available in papers, presentations, and interactive resources on our web sites. We also provide listings and links to software tools and data sets shared, and statistics reflecting their usage. sources. Finally, we offer a “CAIDA in numbers” section: statistics on our performance, financial reporting, and supporting resources, including visiting scholars and students, and all funding sources.
For the full 2015 annual report, see http://www.caida.org/home/about/annualreports/2015/