Archive for the 'Data Collection' Category

Toward a Congestion Heatmap of the Internet

Friday, June 3rd, 2016 by Amogh Dhamdhere

In the past year, we have made substantial progress on a system to measure congestion on interdomain links between networks. This effort is part of our NSF-funded project on measuring interdomain connectivity and congestion. The basic nugget of our technique is to send TTL-limited probes from a vantage point (VP) within a network, toward the near and the far end of an interdomain (border) link of that network, and to monitor diurnal patterns in the near and far-side time series. We refer to this method as “Time-Series Latency Probing”, or TSLP. Our hypothesis is that a persistently elevated RTT to the far end of the link, but no corresponding RTT elevation to the near side, is a signal of congestion at the interdomain link.

It turns out that identifying interdomain links from a VP inside a network is surprisingly challenging, for several reasons: lack of standard IP address assignment practices for inter domain links; unadvertised address space by ISPs; and myriad things that can go wrong with traceroute measurements (third-party addresses, unresponsive routers). See our paper at the 2014 Internet Measurement Conference (IMC) for a description of these issues. To overcome those challenges and identify network borders from within a network, we have developed bdrmap, an active measurement tool to accurately identify interdomain links between networks. A paper describing the bdrmap algorithms is currently under submission to IMC 2016.

Our second major activity in the last year has been to develop a backend system that manages TSLP probing from our set of distributed vantage points, collects and organizes data, and presents that data for easy analysis and visualization. A major goal of the backend system is to be adaptive, i.e., the probing state should adapt to topological and routing changes in the network. To this end, we run the bdrmap topology discovery process continuously on each VP. Every day, we process completed bdrmap runs from each monitor and add newly discovered interdomain links or update the probing state for existing links (i.e., destinations we can use to probe those links, and the distance of those links from our VP). We then push updated probing lists to the monitor. This adaptive process ensures that we always probe a relatively current state of thousands of interdomain links visible from our VPs.

Third, we have greatly expanded the scale of our measurement system. We started this project in 2014 with an initial set of approximately ten VPs in 5-6 access networks mostly in the United States. We are now running congestion measurements from over sixty Archipelago VPs in 39 networks and 26 countries around the world. Our Ark VPs have sufficient memory and compute power to run both the border mapping process and the TSLP probing without any issues. However, when we looked into porting our measurements to other active measurement platforms such as Bismark or the FCC’s measurement infrastructure operated by SamKnows, we found that the OpenWRT-based home routers were too resource-constrained to run bdrmap and TSLP directly. To overcome this challenge, we developed a method to move the bulk of the resource-intensive processing from the VPs to a central controller at CAIDA, so the VP only has to run an efficient probing engine (scamper) with a small memory footprint and low CPU usage. We have deployed a test set of 15 Bismark home routers in this type of remote configuration, with lots of help from the folks at the Bismark Project. Our next target deployment will be a set of >5000 home routers that are part of the FCC-SamKnows Measuring Broadband America infrastructure.

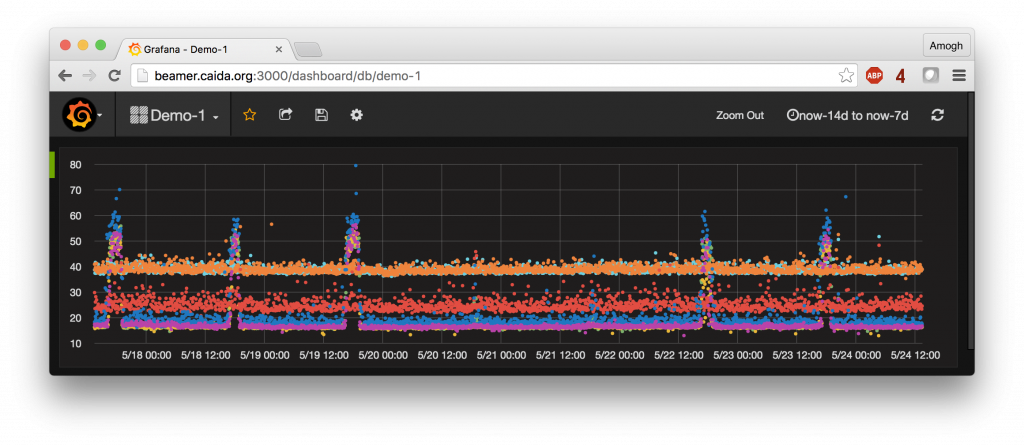
A fourth major advance we have made in the last year is in visualization and analysis of the generated time series data. We were on the lookout for a time series database to store, process and visualize the TSLP data. After some initial experimentation, we found influxDB to be well-suited to our needs, due to its ability to scale to millions of time series, scalable and usable read/write API, and SQL-like querying capability. We also discovered Grafana, a graphing frontend that integrates seamlessly with the influxDB database to provide interactive querying and graphing capability. Visualizing time series plots from a given VP to various neighbor networks and browsing hundreds of time series plots is now possible with a few mouse clicks on the Grafana UI. The figure below shows RTT data for 7 interdomain links between a U.S. access provider and a content provider over the course of a week. This graph took a few minutes to produce with influxDB and Grafana; previously this data exploration would have taken hours using data stored in standard relational databases.


dashboard_agg

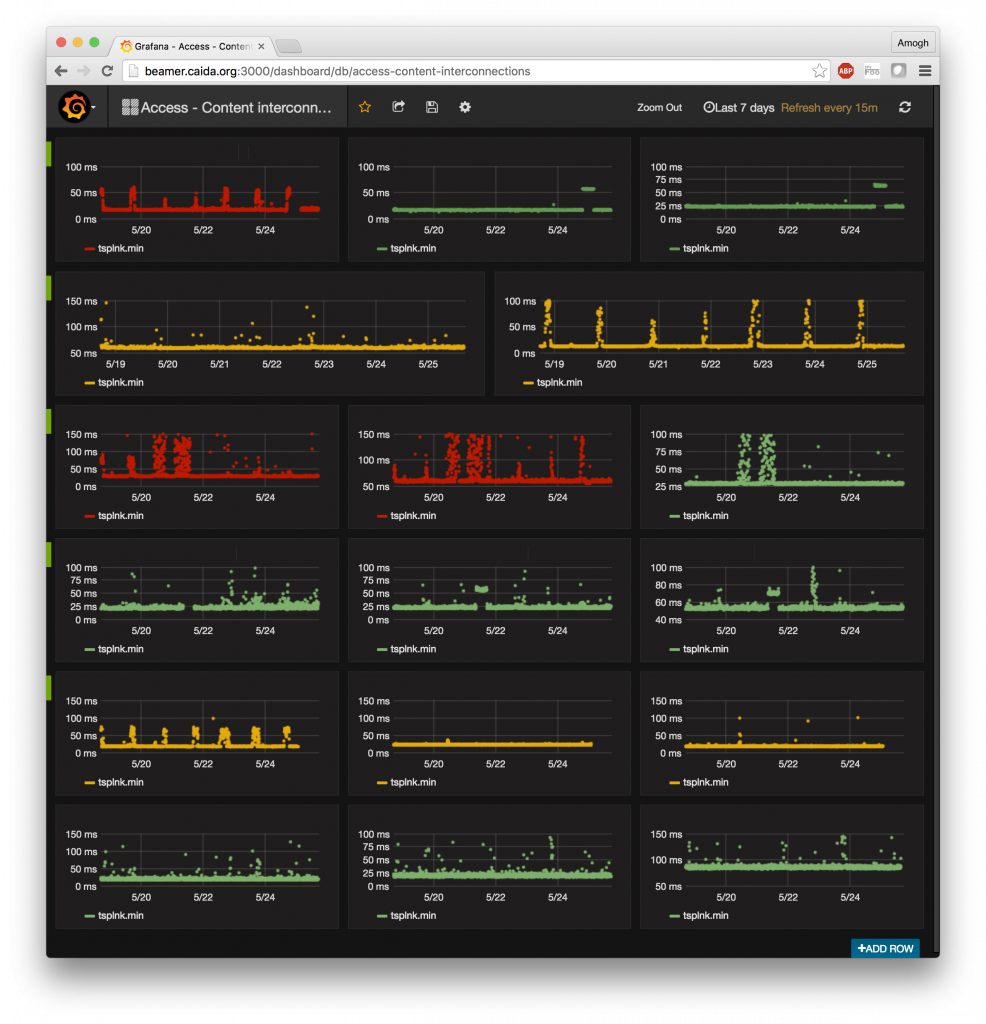
As the cherry on the cake, we have set up the entire system to provide a near real-time view of congestion events. TSLP data is pulled off our VPs and indexed into the influxDB database within 30 minutes of being generated. Grafana provides an auto-refresh mode wherein we can set up a dashboard to periodically refresh when new data is available. There is no technical barrier to shortening the 30-minute duration to an arbitrarily short duration, within reason. The figure below shows a pre-configured dashboard with the real-time congestion state of interdomain links from 5 large access networks in the US to 3 different content providers/CDNs (network names anonymized). Several graphs on that dashboard show a diurnal pattern that signals evidence of congestion on the interdomain link. While drawing pretty pictures and having everything run faster is certainly satisfying, it is neither the goal nor the most challenging aspect of this project. A visualization is only as good as the data that goes into it. Drawing graphs was the easy part; developing a sustainable and scalable system that will keep producing meaningful data was infinitely more challenging. We are delighted with where we are at the moment, and look forward to opening up the data exploration interface for external users.

dashboard-ac

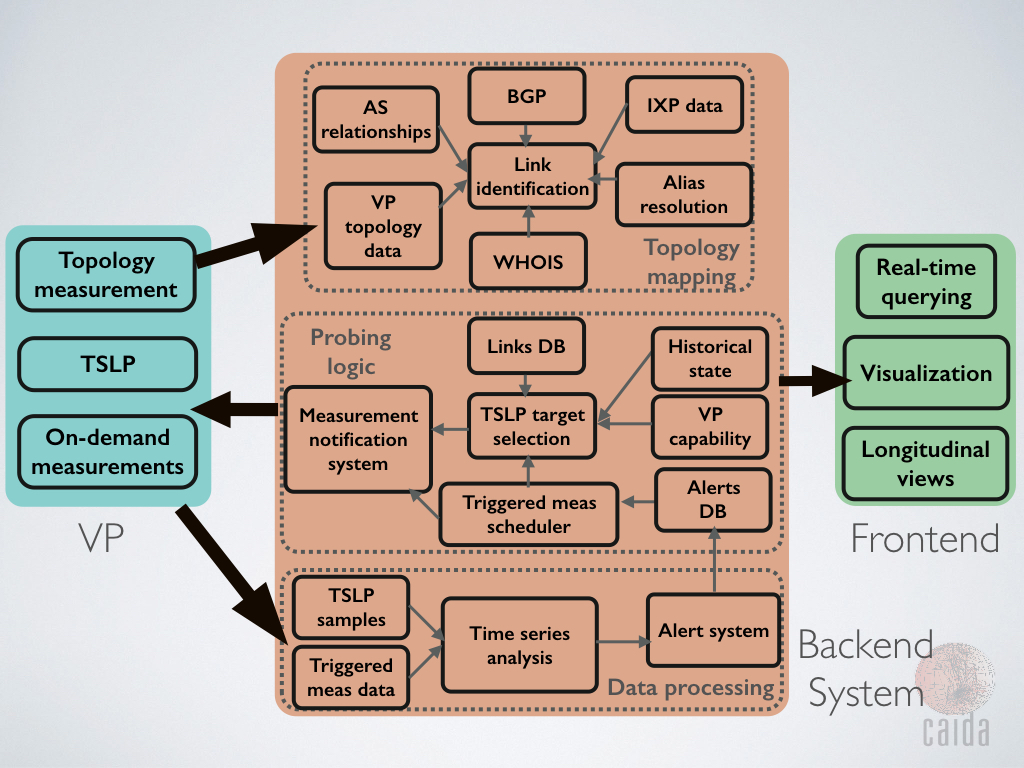
So what happens next? We are far from done here. We are currently working on data analysis modules for time series data with the goal of producing alarms, automatically and without human intervention, that indicate evidence of congestion. Those alarms will be input to a reactive measurement system that we have developed to distribute on-demand measurement tasks to VPs. We envision different types of reactive measurement tasks, e.g., confirming the latency-based evidence of congestion by launching probes to measure loss rate, estimating the impact on achievable throughput by running NDT tests, or estimating potential impacts to user Quality of Experience (QoE). The diagram below shows the various components of the measurement system we are developing. The major piece that remains is continuous analysis of the TSLP data, generating alarms, and pushing on-demand measurements to the reactive measurement system. Stay tuned!

system-diagram

The team: Amogh Dhamdhere, Matthew Luckie, Alex Gamero-Garrido, Bradley Huffaker, kc claffy, Steve Bauer, David Clark
1st CAIDA BGP Hackathon brings students and community experts together

Thursday, February 18th, 2016 by Josh Polterock

We set out to conduct a social experiment of sorts, to host a hackathon to hack streaming BGP data. We had no idea we would get such an enthusiastic reaction from the community and that we would reach capacity. We were pleasantly surprised at the response to our invitations when 25 experts came to interact with 50 researchers and practitioners (30 of whom were graduate students). We felt honored to have participants from 15 countries around the world and experts from companies such as Cisco, Comcast, Google, Facebook and NTT, who came to share their knowledge and to help guide and assist our challenge teams.

Having so many domain experts from so many institutions and companies with deep technical understanding of the BGP ecosystem together in one room greatly increased the kinetic potential for what we might accomplish over the course of our two days.

(more…)

Recent collections added to DatCat

Monday, September 29th, 2014 by Paul Hick

As announced in the CAIDA blog “Further Improvements to the Internet Data Measurement Catalog (DatCat)” of August 26, 2014, the new Internet Data Measurement Catalogue DatCat is now operational. New entries by the community are welcome, and about a dozen have been added so far. We plan to advertise new and interesting entries on a regular basis with a short entry in this blog. This is the first contribution in this series.

Added on July 31, 2014, was the collection “DNS Zone Files”.

http://imdc.datcat.org/collection/1-0718-Y=DNS-Zone-Files;
contributed 2014-07-31 by Tristan Halvorson:

This collection contains Zone files with NS and A records for all new (2013 and later) TLDs.

ICANN has opened up the TLD creation process to a large number of new registries with a centralized service for downloading all of this new data. Each TLD has a separate zone file, and each zone file contains entries for every registered domain. This data collection contains step-by-step instructions to acquire this data directly from the registries through ICANN. This method only works for TLDs released during 2013 or later.

DHS S&T PREDICT PI Meeting, Marina del Rey, CA

Friday, June 6th, 2014 by Josh Polterock

On 28-29 May 2014, DHS Science and Technology Directorate (S&T) held a meeting of the Principal Investigators of the PREDICT (Protected Repository for the Defense of Infrastructure Against Cyber Threats) Project, an initiative to facilitate the accessibility of computer and network operational data for use in cybersecurity defensive R&D. The project is a three-way partnership among government, critical information infrastructure providers, and security development communities (both academic and commercial), all of whom seek technical solutions to protect the public and private information infrastructure. The primary goal of PREDICT is to bridge the gap between producers of security-relevant network operations data and technology developers and evaluators who can leverage this data to accelerate the design, production, and evaluation of next-generation cybersecurity solutions.

In addition to presenting project updates, each PI presented on a special topic suggested by Program Manager Doug Maughan. I presented some reflective thoughts on 10 Years Later: What Would I Have done Differently? (Or what would I do today?). In this presentation, I revisited my 2008 top ten list of things lawyers should know about the Internet to frame some proposed forward-looking strategies for the PREDICT project in 2014.

Also noted at the meeting, DHS recently released a new broad agency announcement (BAA) that will contractually require investigators contribute into PREDICT any data created or used in testing and evaluation of the funded work (if the investigator has redistribution rights, and subject to appropriate disclosure control).

CAIDA Delivers More Data To the Public

Wednesday, February 12th, 2014 by Paul Hick

As part of our mission to foster a collaborative research environment in which data can be acquired and shared, CAIDA has developed a framework that promotes wide dissemination of our datasets to researchers. We classify a dataset as either public or restricted based on a consideration of privacy issues involved in sharing it, as described in our data sharing framework document Promotion of Data Sharing (http://www.caida.org/data/sharing/).

Public datasets are available for downloaded from our public dataserver (http://data.caida.org) subject to conditions specified in our Acceptable Use Agreement (AUA) for public data (http://www.caida.org/home/legal/aua/public_aua.xml). CAIDA provides access to restricted datasets conditionally to qualifying researchers of academic and CAIDA-member institutions agreeing to a more restrictive AUA (http://www.caida.org/home/legal/aua/).

In January 2014 we reviewed our collection of datasets in order to re-evaluate their classification. As a result, as of February 1, we have converted several popular restricted CAIDA datasets into public datasets, including most of one of our largest and most popular data collections: topology data from the (now retired) skitter measurement infrastructure (operational between 1998 and 2008), and its successor, the Archipelago (or Ark) infrastructure (operational since September 2007). We have now made all IPv4 measurements older than two years (which includes all skitter data) publicly available. In addition to the raw data, this topology data includes derived datasets such as the Internet Topology Data Kits (ITDKs). Further, to encourage research on IPv6 deployment, we made our IPv6 Ark topology and performance measurements, from,December 2008 up to the present, publicly available as a whole. We have added these new public data to the existing category of public data sets, which includes AS links data inferred from traceroute measurements taken by skitter and Ark platforms.

Several other datasets remain under consideration for public release, so stay tuned. For an overview of all datasets currently provided by CAIDA (both public and restricted) see our data overview page (http://www.caida.org/data/overview/).

Support for this data collection and sharing provided by DHS Science and Technology Directorate’s PREDICT project via Cooperative Agreement FA8750-12-2-0326 and NSF’s Computing Research Infrastructure Program via CNS-0958547.


(Re)introducing the Internet Measurement Data Catalog (DatCat)

Monday, October 7th, 2013 by Josh Polterock

In 2002, we began to create a metadata catalog where operators and other data owners could index their datasets. We were motivated by several goals we hoped the catalog would enable: data providers sharing data with researchers; researchers finding data to support specific research questions; promoting reproducibility of scientific results using Internet data; and correlating heterogeneous measurement data to analyze macroscopic Internet trends. This last goal was perhaps the most ambitious: we imagined a scenario where enough data would be richly enough indexed that the metadata itself would reveal macroscopic trends about Internet (traffic) characteristics, e.g., average packet size over time, average fraction of traffic carried via HTTP, without even needing to touch the underlying traffic data (netflow or pcap files).

To support this variety of uses of the catalog, we developed a rich metadata model that supported extremely precise descriptions of indexed data sets. For a given data set, one could specify: a description of a collection of files with similar purpose; scholarly paper, articles or publications that make use of the data; descriptions of the files containing the actual data and its format; the package format used for download; contact information; location of the data; a list of keywords; the size of the files/collection; the geographic, network, and logical location of the data; the platform used to collect the data; the start time, end time, and duration; and free form user notes. We allowed searching on any of these fields.

The catalog allows the user to not only index data but also flexibly group data sets into collections, link collections to entries describing the tools used to collect the data, and link collections to publications that used the data. We considered many corner cases and implemented our complex metadata model in an industrial strength relational database. We released the Internet Measurement Data Catalog (DatCat) in June of 2006, prepopulated with our own data sets and introduced via a hands-on workshop where we helped create scripts to assist other researchers in indexing their own data for contribution to the catalog.

In retrospect, we over-complicated the data model and the process of data indexing. Having undertaken data collection for years ourselves, we were familiar with the jargon used to describe precise characteristics of data and the variety of scenarios in which users collect Internet data. We tried to cover each and every possible case. We overshot. The result was a cumbersome and time-consuming interface. Based on feedback from those who took the time to contribute to DatCat, it became clear that we needed to streamline the submission interface. Further, we had built the original service atop an expensive, proprietary database that incurred unnecessary licensing costs.

In August 2011, NSF’s SDCI program provided support for three additional tasks building on what we learned: (1) reduce the burden on those contributing data via a streamlined interface and tools for easier indexing, annotation and navigation of relevant data; (2) convert from use of a proprietary database backend (Oracle) to a completely open source solution (Postgresql); and (3) expand DatCat’s relevance to the cybersecurity and other research communities via forums.

The new database objects have drastically fewer required fields so that contributors can more easily enter new dataset collections. The new streamlined collections require only collection name, short description, and summary fields. We have the new DatCat web site back online serving with the new open-source Postgresql database backend and streamlined interface. Also, we developed a public forums interface to hold discussions of data sharing issues and to answer frequently asked questions regarding the DatCat and the information it contains.

We hope that DatCat evolves to become a lightweight mechanism supporting operators and researchers who want to announce the availability and existence of datasets relevant to (cybersecurity) research. It could also assist NSF PIs with the new requirement that every proposal must include a data management plan for documenting types of data, data and metadata standards, policies for access, sharing, and provisions for re-use, re-distribution, and derivative works and location of archives. Finally, we hope the DatCat service will facilitate collaboration among cybersecurity and network researchers and operators around the world.

We now invite you to take a(nother) look at the Internet Measurement Data Catalog (DatCat). Please point your browser at http://imdc.datcat.org/, browse the catalog, run a few searches, crawl the keywords, create an account, and index your favorite dataset. Please send any questions or feedback to info at datcat dot org.

Targeted Serendipity: the Search for Storage

Wednesday, April 4th, 2012 by Josh Polterock

On the heels of our recent press release regarding fresh publications that  make use of the UCSD Network Telescope data, we would like to take a moment to thank the institutions that have helped preserve this data over the last eight years. Though we recently received an NSF award to enable  near-real-time sharing of this data as well as improved classification, the award does not cover the cost to maintain this historic archive. At current UCSD rates, the 104.66 TiB would cost us approximately $40,000 per year to store. This does not take into account the metadata we have collected which adds roughly 20 TB to the original data.  As a result, we had spent the last several months indexing this data in preparation for deleting it forever.

Then, last month, I had the opportunity to attend the Security at the Cyberborder Workshop in Indianapolis. This workshop focused on how the NSF-funded IRNC networks might (1) capture and articulate technical and policy cybersecurity considerations related to international research network connections, and (2) capture opportunities and challenges for the those connections to foster cybersecurity research.  I did not expect to find a new benefactor for storage of our telescope data at the workshop though, in fact, I did.

(more…)

Internet Censorship Revealed Through the Haze of Malware Pollution

Wednesday, March 28th, 2012 by Josh Polterock

We were happy to see the coverage of UCSD’s press release describing two papers we recently published, introducing new methods and applications for analyzing dark net data (aka “Internet background radiation” or IBR).  The first paper, “Analysis of Country-wide Internet Outages Caused by Censorship”, presented by author Alberto Dainotti last November at IMC 2011, focused on using IBR in conjunction with other data sources to reveal previously unreported aspects of the disruptions seen during the uprisings of early 2011 in Egypt and Libya. The second paper, “Extracting benefit from harm: using malware pollution to analyze the impact of political and geophysical events on the Internet”, published in ACM SIGCOMM CCR (January 12), used IBR data observed by UCSD’s network telescope to characterize Internet outages caused by natural disasters. In both cases the analysis of this (mostly malware-generated) background traffic contributed to our understanding of events unrelated to the malware itself. Our press release was picked up by several online publications, including The Wall Street Journal Blog, ACM TechnewsCommunications of the ACM Web siteSpacedailyPhysorgTom’s GuideProduct Design & DevelopmentNewswiseDomain-bEurekAlertEurasia reviewSecurity-today.comEverything San DiegoSpacewar Cyber War.

The papers are also available on CAIDA’s publications page.

data collection and reporting requirements for broadband stimulus recipients

Thursday, November 12th, 2009 by kc

No one was more surprised than I to see data collection requirements in the NTIA’s Notice of Funds Availability (NOFA) for the Rural Utilities Service’s (RUS) Broadband Initiatives Program (BIP) and the Broadband Technology Opportunities Programs (BTOP):

(more…)

Proposal for ICANN/RIR scenario planning exercise

Monday, May 25th, 2009 by kc

Internet infrastructure economics research”, and how to do reasonable examples of it, has come up a lot lately, so i’m posting a brief description of an academic+icann community workshop i’ve been recommending for a few years, which has yet to happen, and (I still believe) is long past due, and specifically more important than passing policies, especially emergency ones to allow IP address markets with no supporting research on the impact on security and stability of the Internet, and even at the risk of killing IPv6 altogether.]

(more…)