Archive for the 'Commentaries' Category

TCP Congestion Signatures

Tuesday, February 6th, 2018 by Amogh Dhamdhere

Roadsign: TCP Congestion Ahead

Congestion in the Internet is an age-old problem. With the rise of broadband networks, it had been implicitly accepted that congestion is most likely to occur in the ‘last mile’, that is, the broadband link between the ISP and the home customer. This is due to service plans or technical factors that limit the bandwidth in the last mile.

However, two developments have challenged this assumption: the improvement in broadband access speeds, and the exponential growth in video traffic.

Video traffic now consumes a significant fraction of bandwidth even in transit networks, to the extent that interconnection points between major networks can also be potential sources of congestion. A case in point is the widespread interconnection congestion reported between transit network Cogent and several US access ISPs, in 2014.

It is therefore important to understand where congestion occurs—if it occurs in the last mile, then users are limited by their service plan, and if it occurs elsewhere, they are limited by forces outside of their control.

Although there are many TCP forensic tools available, ranging from simple speed tests to more sophisticated diagnostic tools, they do not give information beyond available throughput or that the flow was limited by congestion or other factors such as latency.

Using TCP RTT to distinguish congestion types

In our paper ‘TCP Congestion Signatures‘, which we recently presented at the 2017 Internet Measurement Conference, we developed and validated techniques to identify whether a TCP flow was bottlenecked by:

  • (i) an initially unconstrained path (that the connection then fills), or
  • (ii) an already congested path.

Our method works without prior knowledge about the path, for example, the capacity of its bottleneck link. As a specific application of this general method, the technique can distinguish congestion experienced on interconnection links from congestion that naturally occurs when a last-mile link is filled to capacity. In TCP terms, we re-articulate the question: was a TCP flow bottlenecked by an already congested (possibly interconnect) link, or did it induce congestion in an otherwise lightly loaded (possibly a last-mile) link?

We use simple intuition based on TCP dynamics to answer this question: TCP’s congestion control mechanism affects the round-trip time (RTT) of packets in the flow. In particular, as TCP scales up to occupy a link that is initially lightly loaded, it gradually fills up the buffer at the head of that link, which in turn increases the flow’s RTT. This effect is most pronounced during the initial slow start period, as the flow throughput increases from zero.

On the contrary, for links that are operating at close to capacity, the buffer at the bottleneck is already occupied, and consequently the new TCP flow’s congestion control does not have a measurable impact on the RTT. In this case, the RTT is more or less constant over the duration of the TCP flow.

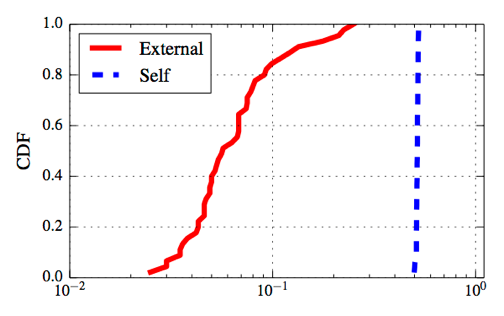
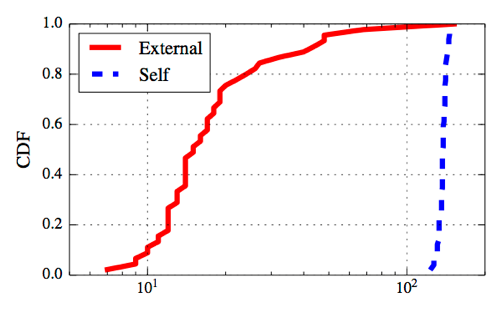
We identify two parameters based on flow RTT during TCP slow start that we use to distinguish these two cases: the coefficient of variation and the normalized difference between the minimum and maximum RTT. We feed these two parameters, which can be easily estimated for TCP flows, into a simple decision tree classifier. The figures below shows a simple example of these two metrics for a controlled experiment.
Graph

Figure 1. This figure shows the coefficient of variation of packet RTTs during slow start. Flows that are affected by self-induced congestion have higher coefficient of variation than those affected by external congestion.
Graph

Figure 2. This figure shows the difference between the maximum and minimum RTT of packets during slow start for flows that are affected by self-induced congestion (blue) and those affected by external congestion (red). Self-induced congestion causes a larger difference in the RTT.

For this experiment we set up an emulated ‘access’ link with a bandwidth of 20 Mbps and 100 ms buffer, and an ‘interconnect’ link of bandwidth 1 Gbps with a 50 ms buffer. We run throughput tests over the links under two conditions: when the interconnect link is busy (it becomes the bottleneck) and when it is not (the access link becomes the bottleneck), and compute the two metrics for the test flows.

The figures show the cumulative distribution function of the two parameters over 50 runs of the experiment. We see that the two cases are clearly distinguishable: both the coefficient of variation and the difference metrics are significantly higher for the case where the access link is the bottleneck.

We validate our techniques using a variety of controlled experiments and real-world datasets, including data from the Measurement Lab platform during and after the interconnection congestion episode between Cogent and various ISPs in early 2014 — for this case we show that the technique distinguishes the two cases of congestion with high accuracy.

Read TCP Congestion Signatures for more details on the experiment.

Uses and Limitations

Our technique distinguishes between self-induced congestion versus externally induced congestion and can be implemented by content providers (for example, video streaming services and speed test providers). The provider would only need to configure the servers to measure the TCP flow during slow start. While we currently use packet captures to extract the metrics we need, we are exploring lighter-weight techniques that require fewer resources.

Implementing such a capability would help a variety of stakeholders. Users would understand more about what limits the performance they experience, content providers could design better solutions to alleviate the effects of congestion, and regulators of the peering ecosystem could rule out consideration of issues where customers are limited by their own contracted service plan.

In terms of limitations, our technique depends on the existence of buffers that influence RTTs, and TCP variants that attempt to fill those buffers. Newer congestion control variants such as BBR that base their congestion management on RTT (and try to reduce buffering delays) may confound the method; we plan to study this, as well as how such congestion control mechanisms interact with older TCP variants, in future work.

Contributors: Amogh Dhamdhere, Mark Allman and kc Claffy

Srikanth Sundaresan’s research interests are in the design and evaluation of networked systems and applications. This work is based on a research paper written when he was at Princeton University. He is currently a software engineer at Facebook.
AS Rank (updated!)

Tuesday, January 16th, 2018 by Bradley Huffaker

CAIDA welcomes the new year with an update to one of our flagship services, http://as-rank.caida.org/. As part of our new NSF project “DIBBs: Integrated Platform for Applied Network Data Analysis (PANDA)” we will offer researchers more accessible calibrated user-friendly tools for collecting, analyzing, querying, and interpreting measurements of the Internet ecosystem. Our razing and redesign of the AS Rank v1 service represents the beginning of efforts to build toward this new platform. For this update we did a complete redesign with entirely new backend database (redis), web application framework (Symfony), and front-end web development environment (Bootstrap 4). The redesigned service focuses on optimizing query efficiency to serve a larger user population (We would like to have the capability to support concurrent queries from 30+ students in a classroom.) It also focuses on getting the data to researchers in a useful format (JSON) via a new programmatic interface to the AS Rank data. To see the details, check out the new RESTFUL API documentation at http://as-rank.caida.org/api/v1. September 2019 Update: AS Rank version 2 no longer uses the RESTFUL API.

Those who remember the old service may know the performance challenges we experienced and so understand the need to start fresh. The decision to start from scratch means that we will need to reimplement quite a number of features to get back to the full functionality provided by the previous server. We plan to expand its features over the coming months. Please send your ideas for features you would find especially useful to asrank-feedback@caida.org.

New and improved AS Rank.


CAIDA’s 2016 Annual Report

Tuesday, May 9th, 2017 by kc

[Executive summary and link below]

The CAIDA annual report summarizes CAIDA’s activities for 2016, in the areas of research, infrastructure, data collection and analysis. Our research projects span Internet topology, routing, security, economics, future Internet architectures, and policy. Our infrastructure, software development, and data sharing activities support measurement-based internet research, both at CAIDA and around the world, with focus on the health and integrity of the global Internet ecosystem. The executive summary is excerpted below:

Mapping the Internet. We continued to expand our topology mapping capabilities using our Ark measurement infrastructure. We improved the accuracy and sophistication of our topology annotations, including classification of ISPs, business relationships between them, and geographic mapping of interdomain links that implement these relationships. We released two Internet Topology Data Kits (ITDKs) incorporating these advances.

Mapping Interconnection Connectivity and Congestion. We continued our collaboration with MIT to map the rich mesh of interconnection in the Internet in order to study congestion induced by evolving peering and traffic management practices of CDNs and access ISPs. We focused our efforts on the challenge of detecting and localizing congestion to specific points in between networks. We developed new tools to scale measurements to a much wider set of available nodes. We also implemented a new database and graphing platform to allow us to interactively explore our topology and performance measurements. We produced related data collection and analyses to enable evaluation of these measurements in the larger context of the evolving ecosystem: infrastructure resiliency, economic tussles, and public policy.

Monitoring Global Internet Security and Stability. We conducted infrastructure research and development projects that focus on security and stability aspects of the global Internet. We developed continuous fine-grained monitoring capabilities establishing a baseline connectivity awareness against which to interpret observed changes due to network outages or route hijacks. We released (in beta form) a new operational prototype service that monitors the Internet, in near-real-time, and helps identify macroscopic Internet outages affecting the edge of the network.

CAIDA also developed new client tools for measuring IPv4 and IPv6 spoofing capabilities, along with services that provide reporting and allow users to opt-in or out of sharing the data publicly.

Future Internet Architectures. We continued studies of IPv4 and IPv6 paths in the Internet, including topological congruency, stability, and RTT performance. We examined the state of security policies in IPv6 networks, and collaborated to measure CGN deployment in U.S. broadband networks. We also continued our collaboration with researchers at several other universities to advance development of a new Internet architecture: Named Data Networking (NDN) and published a paper on the policy and social implications of an NDN-based Internet.

Public Policy. Acting as an Independent Measurement Expert, we posted our agreed-upon revised methodology for measurement methods and reporting requirements related to AT&T Inc. and DirecTV merger (MB Docket No. 14-90). We published our proposed method and a companion justification document. Inspired by this experience and a range of contradicting claims about interconnection performance, we introduced a new model describing measurements of interconnection links of access providers, and demonstrated how it can guide sound interpretation of interconnection-related measurements regardless of their source.

Infrastructure operations. It was an unprecedented year for CAIDA from an infrastructure development perspective. We continued support for our existing active and passive measurement infrastructure to provide visibility into global Internet behavior, and associated software tools and platforms that facilitate network research and operational assessments.

We made available several data services that have been years in the making: our prototype Internet Outage Detection and Analysis service, with several underlying components released as open source; the Periscope platform to unify and scale querying of thousands of looking glass nodes on the global Internet; our large-scale Internet topology query system (Henya); and our Spoofer system for measurement and analysis of source address validation across the global Internet. Unfortunately, due to continual network upgrades, we lost access to our 10GB backbone traffic monitoring infrastructure. Now we are considering approaches to acquire new monitors capable of packet capture on 100GB links.

As always, we engaged in a variety of tool development, and outreach activities, including maintaining web sites, publishing 13 peer-reviewed papers, 3 technical reports, 4 workshop reports, one (our first) BGP hackathon report, 31 presentations, 20 blog entries, and hosting 6 workshops (including the hackathon). This report summarizes the status of our activities; details about our research are available in papers, presentations, and interactive resources on our web sites. We also provide listings and links to software tools and data sets shared, and statistics reflecting their usage. Finally, we report on web site usage, personnel, and financial information, to provide the public a better idea of what CAIDA is and does.

For the full 2016 annual report, see http://www.caida.org/home/about/annualreports/2016/

Response to RFI for Future Needs for Advanced Cyberinfrastructure to Support Science and Engineering Research

Tuesday, April 18th, 2017 by kc

I sent the following to NSF in response to a recent Request for Information (RFI) for Future Needs for Advanced Cyberinfrastructure to Support Science and Engineering Research. (The format required an abstract and answers to 3 specific questions.)

Abstract

As the Internet and our dependence on it have grown, the structure and dynamics of the network, and how it relates to the political economy in which it is embedded, have gathered increasing attention by researchers, operators and policy makers. All of these stakeholders bring questions that they lack the capability to answer themselves. Epistemological challenges lie in developing and deploying measurement instrumentation and protocols, expertise required to soundly interpret and use complex data, lack of tools to synthesize different sources of data to reveal insights, data management cost and complexity, and privacy issues. Although a few interdisciplinary projects have succeeded, the current mode of collaboration simply does not scale to the exploding interest in scientific study of the Internet, nor to complex and visionary scientific uses of CAIDA’s data by non-networking experts. We believe the community needs a new shared cyberinfrastructure resource that integrates active Internet measurement capabilities, multi-terabyte data archives, live data streams, heavily curated topology data sets revealing coverage and business relationships, and traffic measurements. Such a resource would enable a broad set of researchers to pursure new scientific directions, experiments, and data products that promote valid interpretations of data and derived inferences.

(more…)

Why IP source address spoofing is a problem and how you can help.

Friday, March 24th, 2017 by Bradley Huffaker

video: http://www.caida.org/publications/animations/security/spoofer-sav-intro
information: Software Systems for Surveying Spoofing Susceptibility
download: https://spoofer.caida.org/

This material is based on research sponsored by the Department of Homeland Security (DHS) Science and Technology Directorate, Homeland Security Advanced Research Projects Agency, Cyber Security Division (DHS S&T/HSARPA/CSD) BAA HSHQDC-14-R-B0005, and the Government of United Kingdom of Great Britain and Northern Ireland via contract number D15PC00188. Views should not be interpreted as necessarily representing the official policies or endorsements, either expressed or implied, of Department of Homeland Security, the U.S. Government, or the Government of United Kingdom of Great Britain and Northern Ireland.

Help save the Internet: Install the new Spoofer client (v1.1.0)!

Sunday, December 18th, 2016 by Josh Polterock

The greatest security vulnerability of the Internet (TCP/IP) architecture is the lack of source address validation, i.e., any sender may put a fake source address in a packet, and the destination-based routing protocols that glue together the global Internet will get that packet to its intended destination. Attackers exploit this vulnerability by sending many (millions of) spoofed-source-address packets to services on the Internet they wish to disrupt (or take offline altogether). Attackers can further leverage intermediate servers to amplify such packets into even larger packets that will cause greater disruption for the same effort on the attacker’s part.

Although the IETF recommended best practices to mitigate this vulnerability by configuring routers to validate that source addresses in packets are legitimate, compliance with such practices (BCP38 and BCP84) are notoriously incentive-incompatible. That is, source address validation (SAV) can be a burden to a network who supports it, but its deployment by definition helps not that network but other networks who are thus protected from spoofed-source attacks from that network. Nonetheless, any network who does not deploy BCP38 is “part of the DDoS problem”.

Over the past several months, CAIDA, in collaboration with Matthew Luckie at the University of Waikato, has upgraded Rob Beverly’s original spoofing measurement system, developing new client tools for measuring IPv4 and IPv6 spoofing capabilities, along with services that provide reporting and allow users to opt-in or out of sharing the data publicly. To find out if your network provider(s), or any network you are visiting, implements filtering and allow IP spoofing, point your web browser at http://spoofer.caida.org/ and install our simple client.

This newly released spoofer v1.1.0 client has implemented parallel probing of targets, providing a 5x increase in speed to complete the test, relative to v.1.0. Among other changes, this new prober uses scamper instead of traceroute when possible, and has improved display of results. The installer for Microsoft Windows now configures Windows Firewall.

For more technical details about the problem of IP spoofing and our approach to measurement, reporting, notifications and remediation, see the slides from Matthew Luckie’s recent slideset, “Software Systems for Surveying Spoofing Susceptibility”, presented to the Australian Network Operators Group (AusNOG) in September 2016.

The project web page reports recently run tests from clients willing to share data publicly, test results classified by Autonomous System (AS) and by country, and a summary statistics of IP spoofing over time. We will enhance these reports over the coming months.

This material is based on research sponsored by the Department of Homeland Security (DHS) Science and Technology Directorate, Homeland Security Advanced Research Projects Agency, Cyber Security Division (DHS S&T/HSARPA/CSD) BAA HSHQDC-14-R-B0005, and the Government of United Kingdom of Great Britain and Northern Ireland via contract number D15PC00188. Views should not be interpreted as necessarily representing the official policies or endorsements, either expressed or implied, of Department of Homeland Security, the U.S. Government, or the Government of United Kingdom of Great Britain and Northern Ireland.

Henya: Large-Scale Internet Topology Query System

Saturday, December 17th, 2016 by Josh Polterock

CAIDA’s Internet topology mapping experiment running on our Ark infrastructure has collected traceroute-like measurements of the Internet from nodes hosted in academic, commercial, transit, and residential networks around the globe since September 2007. Discovery of the full potential value of this raw data is best served by a rich, easy-to-use interactive exploratory interface. We have implemented a web-based query interface — henya — to allow researchers to find the most relevant data for their research, such as all traceroutes through a given region and time period toward/across a particular prefix/AS.

We hope that Henya’s large-scale topology query system will become a powerful tool in the researcher’s toolbox for remotely searching CAIDA’s traceroute data. Built-in analysis and visualization modules (still under development) will facilitate our understanding of route and prefix hijacking events as well as provide us with the means to conduct longitudinal analysis. Below we show a screenshot of Henya’s query interface, but Young Hyun, Henya’s creator, also created a useful short introduction video.

henya-query

(A note about the name Henya: Jeju, an island off the coast of South Korea, has a long history of free diving. Over the past few centuries, skilled women divers called haenyeo (pronounced “HEN-yuh”, literally “sea women”) earned their living harvesting and selling various sea-life. Highly-trained haenyeo can dive up to 30 meters deep and can hold their breath for over three minutes. Through this tiring and dangerous work, these women became the breadwinners of their families. Sadly the tradition has nearly died out, with only a few thousand practitioners left, nearly all of the them elderly. Free diving is an inspiring metaphor for data querying, and we thought this name would serve to honor this dying tradition by preserving the name in the topo-query system.)

The work was funded by the Department of Homeland Security (DHS) Science and Technology Directorate, Cyber Security Division DHS S&T/CSD) Broad Agency Announcement 11-02 and SPAWAR Systems Center Pacific via contract number N66001-12-C-0130, and by Research and Development Canada (DRDC) pursuant to an Agreement between the U.S. and Canadian governments for Cooperation in and Technology for Critical Infrastructure Protection and Border Security. The work represents the position of the authors and necessarily that of DHS or DRDC.

bdrmap: Inference of Borders Between IP Networks

Thursday, December 1st, 2016 by Josh Polterock

Matthew Luckie presented some recent topology research results of CAIDA’s NSF-funded Internet interconnection mapping project at the recent ACM 2016 Internet Measurement Conference in Santa Monica, CA. This measurement, data analysis, and software tool development project focused on automatic inference of network boundaries in traceroute. The paper explains why such a conceptually simple task is hard in the real world, and how lack of progress has impeded a wide range of research and development efforts for decades. We developed and validated a method that uses targeted traceroutes, knowledge of traceroute idiosyncrasies, and codification of topological constraints in a structured set of heuristics, to correctly identify interdomain links at the granularity of individual border routers. We limited our scope to those network boundaries we have most confidence we can accurately infer in the presence of inherent sampling bias: interdomain links attached to the network launching the traceroute. We developed a scalable implementation of our algorithm and validated it against ground truth information provided by four networks on 3,277 links, which showed 96.3% – 98.9% of our inferences for these links were correct. With 19 vantage points (VPs) distributed across a large U.S. broadband provider, we used our method to reveal the tremendous density of router-level interconnection between some ASes. For example, in January 2016, we observed 45 router-level links between one large U.S. broadband provider and one of its Tier-1 peers. We also quantified the VP deployment required to observe this ISP’s interdomain connectivity, finding that we needed 17 VPs to observe all 45 links. Our method forms the cornerstone of the system we are now building to map interdomain performance. We released our code as a new module of the open source scamper measurement tool.

Our approach begins with assembling routing and addressing data used to inform data collection and analysis. Then, we deploy an efficient variant of traceroute to trace the path from each VP to every routed prefix observed in the global BGP routing system. We apply alias resolution techniques to infer routers and point-to-point links used for interdomain interconnection. We then use this collected data to assemble constraints that guide our execution of heuristics to infer router ownership.

The data collected on the Ark infrastructure using this new methodology to construct an improved router-level map will provide input for development of applications and experiments in several research areas including studies on interdomain congestion, better solutions for AS path prediction and development of a reliable tool for AS-level traceroute.

This work was supported by NSF-funded grant: CNS-1414177, and the DHS S&T contracts N66001-12-C-0130 and HHSP 233201600012C.

BGPstream: a software framework for live and historical BGP data analysis

Wednesday, November 23rd, 2016 by kc

One of the three CAIDA papers presented at ACM’s 2016 Internet Measurement Conference this month punctuated years of work to develop an open-source software framework for the analysis of historical and real-time BGP (border gateway protocol, the Internet’s interdomain routing protocol) data. Although BGP is a crucial operational component of the Internet infrastructure, and is the subject of research in the areas of Internet performance, security, topology, protocols, economics, etc., until now there has been no efficient way of processing large amounts of distributed and/or live BGP measurement data. BGPStream fills this gap, enabling efficient investigation of events, rapid prototyping, and building complex tools large-scale monitoring applications (e.g., detection of connectivity disruptions or BGP hijacking attacks).

We released the BGPstream platform earlier in the year, and it has already served to support projects at three hackathons, starting with CAIDA’s First BGP hackathon in February 2016. Then in June 2016, John Kristoff led a project at NANOG’s first hackathon (June 2016); when he presented the project results he noted, “Ultimately, [BGPStream] was going to save us a tremendous amount of time because this provided us with an interface into routing data that CAIDA collects and aggregates from multiple places. That allowed us to build short pieces of code that would tie in pulling out information based on community tag or next hop address.” Most recently at the RIPE NCC IXP Tools Hackathon in October 2016, the Universal Looking Glass team based their analysis on BGPStream, and worked to add the BGP measurement data published by Packet Clearing House as a data source supported by BGPStream.

Other researchers have also already made use of BGPstream for Internet path prediction projects, including Sibyl: A Practical Internet Route Oracle (where they used BGPstream to extract AS paths for comparison against traceroute measurements), and PathCache: a path prediction toolkit.

The IMC paper describes the goals and architecture of BGPStream, and uses case studies to illustrate how to apply the components of the framework to different scenarios, including complex services for global Internet monitoring that we built on top of it.

It was particularly gratifying to hear the next speaker in the session at the conference begin his talk by saying that BGPstream would have made the work he was about to present a lot easier. That’s exactly the impact we hope BGPstream has on the community!

The work was supported by two NSF-funded grants: CNS-1228994 and CNS-1423659, and the DHS-funded contract N66001-12-C-0130.

Geolocation Terminology: Vantage Points, Landmarks, and Targets

Thursday, November 17th, 2016 by Bradley Huffaker

While reviewing a recent paper, it occurred to me there is a pretty serious nomenclature inconsistency across Internet measurement research papers that talk about geolocation. Specifically, the term landmark is not well-defined. Some literature uses the term landmark to refer to measurement infrastructure (e.g., nodes that source active measurements) in specific known geographic locations [Maziku2013,Komosny2015]. In other literature the same term refers to locations with known Internet identifiers — such as IP addresses — against which one collects calibration measurements [Arif2010,Wang2011,Hu2012,Eriksson2012,Chen2015].

In pursuit of clarity in our field, we recommend the following terms and definitions:

  • A Vantage Point (VP) is a measurement infrastructure node with a known geographic location.
  • A Landmark is a responsive Internet identifier with a known location to which the VP will launch a measurement that can serve to calibrate other measurements to potentially unknown geographic locations.
  • A Target is an Internet identifier whose location will be inferred from a given method. Depending on the type of identifier and inference methodology, this may not be a single well defined location. Typically, some targets have known geographic locations (ground truth), which researchers can use to evaluate the accuracy of their geolocation methodology.
  • A Location is a geographic place that geolocation techniques attempt to infer for a given target. Examples include cities and ISP Points of Presences (PoPs).

Not all papers need to use all terms. Below we depict a simple constraint-based geolocation algorithm to show how we understand these terms in practice.

A simple constraint-based geolocation algorithm.

A simple constraint-based geolocation algorithm.

[Potential useful resource, although not actively maintained: CAIDA’s Geolocation Bibliography]