Henya: Large-Scale Internet Topology Query System
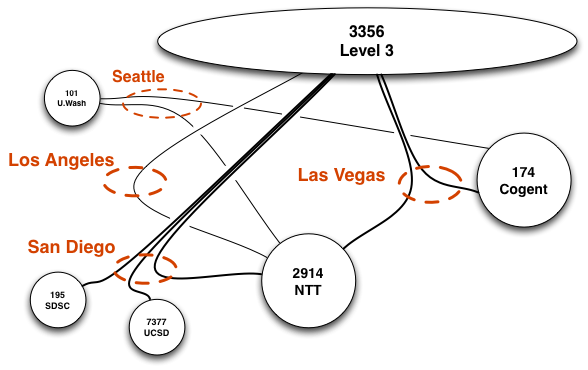
Saturday, December 17th, 2016 by Josh PolterockCAIDA’s Internet topology mapping experiment running on our Ark infrastructure has collected traceroute-like measurements of the Internet from nodes hosted in academic, commercial, transit, and residential networks around the globe since September 2007. Discovery of the full potential value of this raw data is best served by a rich, easy-to-use interactive exploratory interface. We have implemented a web-based query interface — henya — to allow researchers to find the most relevant data for their research, such as all traceroutes through a given region and time period toward/across a particular prefix/AS.
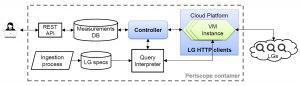
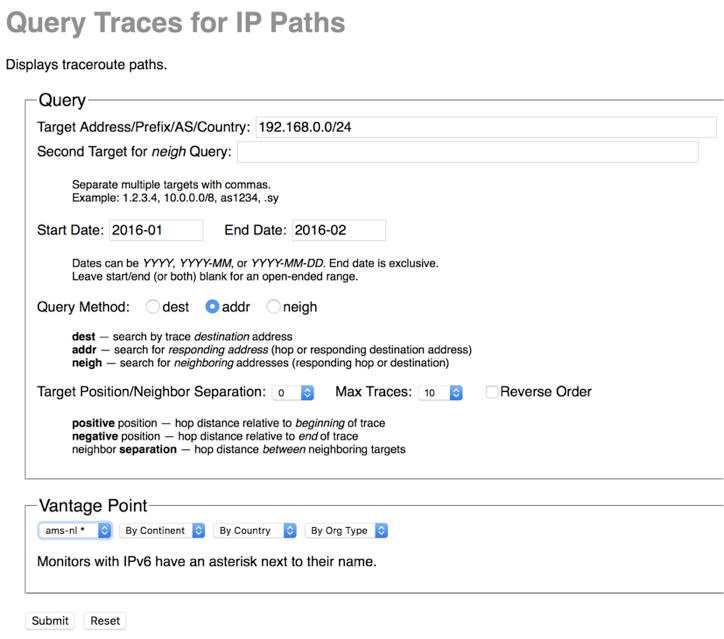
We hope that Henya’s large-scale topology query system will become a powerful tool in the researcher’s toolbox for remotely searching CAIDA’s traceroute data. Built-in analysis and visualization modules (still under development) will facilitate our understanding of route and prefix hijacking events as well as provide us with the means to conduct longitudinal analysis. Below we show a screenshot of Henya’s query interface, but Young Hyun, Henya’s creator, also created a useful short introduction video.
(A note about the name Henya: Jeju, an island off the coast of South Korea, has a long history of free diving. Over the past few centuries, skilled women divers called haenyeo (pronounced “HEN-yuh”, literally “sea women”) earned their living harvesting and selling various sea-life. Highly-trained haenyeo can dive up to 30 meters deep and can hold their breath for over three minutes. Through this tiring and dangerous work, these women became the breadwinners of their families. Sadly the tradition has nearly died out, with only a few thousand practitioners left, nearly all of the them elderly. Free diving is an inspiring metaphor for data querying, and we thought this name would serve to honor this dying tradition by preserving the name in the topo-query system.)
The work was funded by the Department of Homeland Security (DHS) Science and Technology Directorate, Cyber Security Division DHS S&T/CSD) Broad Agency Announcement 11-02 and SPAWAR Systems Center Pacific via contract number N66001-12-C-0130, and by Research and Development Canada (DRDC) pursuant to an Agreement between the U.S. and Canadian governments for Cooperation in and Technology for Critical Infrastructure Protection and Border Security. The work represents the position of the authors and necessarily that of DHS or DRDC.