Archive for the 'Routing' Category

Technological Developments in Broadband Networking at March FTC Hearing

Saturday, May 4th, 2019 by kc

(Forgot to post this earlier, this is old news by now but fwiw..)
I presented at the 10th FTC Hearing on Competition and Consumer Protection in the 21st century this March, held in Washington D.C., giving a talk about Technological Developments in Broadband Networking which aims to address this question: Which (recent and expected) technological developments, or lack thereof, are important for understanding the competitiveness of the industry or impacts on the public interest?

A webcast of the presentation (my talk begins at 10m30s) is available. I also participated in a discussion panel, also webcast.

CAIDA’s Annual Report for 2017

Tuesday, May 29th, 2018 by kc

The CAIDA annual report summarizes CAIDA’s activities for 2017, in the areas of research, infrastructure, data collection and analysis. Our research projects span Internet topology, routing, security, economics, future Internet architectures, and policy. Our infrastructure, software development, and data sharing activities support measurement-based internet research, both at CAIDA and around the world, with focus on the health and integrity of the global Internet ecosystem. The executive summary is excerpted below:
(more…)

TCP Congestion Signatures

Tuesday, February 6th, 2018 by Amogh Dhamdhere

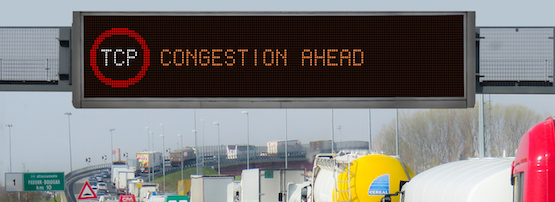
Roadsign: TCP Congestion Ahead

Congestion in the Internet is an age-old problem. With the rise of broadband networks, it had been implicitly accepted that congestion is most likely to occur in the ‘last mile’, that is, the broadband link between the ISP and the home customer. This is due to service plans or technical factors that limit the bandwidth in the last mile.

However, two developments have challenged this assumption: the improvement in broadband access speeds, and the exponential growth in video traffic.

Video traffic now consumes a significant fraction of bandwidth even in transit networks, to the extent that interconnection points between major networks can also be potential sources of congestion. A case in point is the widespread interconnection congestion reported between transit network Cogent and several US access ISPs, in 2014.

It is therefore important to understand where congestion occurs—if it occurs in the last mile, then users are limited by their service plan, and if it occurs elsewhere, they are limited by forces outside of their control.

Although there are many TCP forensic tools available, ranging from simple speed tests to more sophisticated diagnostic tools, they do not give information beyond available throughput or that the flow was limited by congestion or other factors such as latency.

Using TCP RTT to distinguish congestion types

In our paper ‘TCP Congestion Signatures‘, which we recently presented at the 2017 Internet Measurement Conference, we developed and validated techniques to identify whether a TCP flow was bottlenecked by:

  • (i) an initially unconstrained path (that the connection then fills), or
  • (ii) an already congested path.

Our method works without prior knowledge about the path, for example, the capacity of its bottleneck link. As a specific application of this general method, the technique can distinguish congestion experienced on interconnection links from congestion that naturally occurs when a last-mile link is filled to capacity. In TCP terms, we re-articulate the question: was a TCP flow bottlenecked by an already congested (possibly interconnect) link, or did it induce congestion in an otherwise lightly loaded (possibly a last-mile) link?

We use simple intuition based on TCP dynamics to answer this question: TCP’s congestion control mechanism affects the round-trip time (RTT) of packets in the flow. In particular, as TCP scales up to occupy a link that is initially lightly loaded, it gradually fills up the buffer at the head of that link, which in turn increases the flow’s RTT. This effect is most pronounced during the initial slow start period, as the flow throughput increases from zero.

On the contrary, for links that are operating at close to capacity, the buffer at the bottleneck is already occupied, and consequently the new TCP flow’s congestion control does not have a measurable impact on the RTT. In this case, the RTT is more or less constant over the duration of the TCP flow.

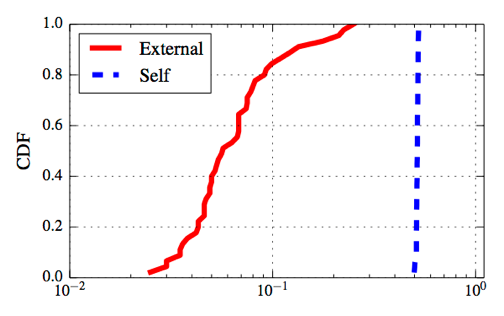
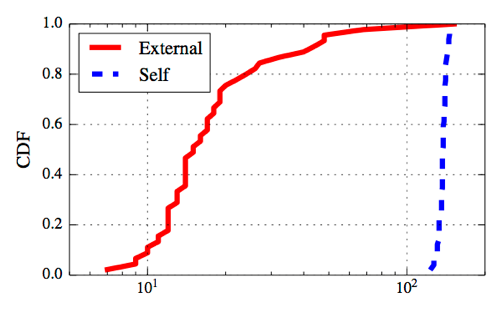
We identify two parameters based on flow RTT during TCP slow start that we use to distinguish these two cases: the coefficient of variation and the normalized difference between the minimum and maximum RTT. We feed these two parameters, which can be easily estimated for TCP flows, into a simple decision tree classifier. The figures below shows a simple example of these two metrics for a controlled experiment.
Graph

Figure 1. This figure shows the coefficient of variation of packet RTTs during slow start. Flows that are affected by self-induced congestion have higher coefficient of variation than those affected by external congestion.
Graph

Figure 2. This figure shows the difference between the maximum and minimum RTT of packets during slow start for flows that are affected by self-induced congestion (blue) and those affected by external congestion (red). Self-induced congestion causes a larger difference in the RTT.

For this experiment we set up an emulated ‘access’ link with a bandwidth of 20 Mbps and 100 ms buffer, and an ‘interconnect’ link of bandwidth 1 Gbps with a 50 ms buffer. We run throughput tests over the links under two conditions: when the interconnect link is busy (it becomes the bottleneck) and when it is not (the access link becomes the bottleneck), and compute the two metrics for the test flows.

The figures show the cumulative distribution function of the two parameters over 50 runs of the experiment. We see that the two cases are clearly distinguishable: both the coefficient of variation and the difference metrics are significantly higher for the case where the access link is the bottleneck.

We validate our techniques using a variety of controlled experiments and real-world datasets, including data from the Measurement Lab platform during and after the interconnection congestion episode between Cogent and various ISPs in early 2014 — for this case we show that the technique distinguishes the two cases of congestion with high accuracy.

Read TCP Congestion Signatures for more details on the experiment.

Uses and Limitations

Our technique distinguishes between self-induced congestion versus externally induced congestion and can be implemented by content providers (for example, video streaming services and speed test providers). The provider would only need to configure the servers to measure the TCP flow during slow start. While we currently use packet captures to extract the metrics we need, we are exploring lighter-weight techniques that require fewer resources.

Implementing such a capability would help a variety of stakeholders. Users would understand more about what limits the performance they experience, content providers could design better solutions to alleviate the effects of congestion, and regulators of the peering ecosystem could rule out consideration of issues where customers are limited by their own contracted service plan.

In terms of limitations, our technique depends on the existence of buffers that influence RTTs, and TCP variants that attempt to fill those buffers. Newer congestion control variants such as BBR that base their congestion management on RTT (and try to reduce buffering delays) may confound the method; we plan to study this, as well as how such congestion control mechanisms interact with older TCP variants, in future work.

Contributors: Amogh Dhamdhere, Mark Allman and kc Claffy

Srikanth Sundaresan’s research interests are in the design and evaluation of networked systems and applications. This work is based on a research paper written when he was at Princeton University. He is currently a software engineer at Facebook.

CAIDA’s 2016 Annual Report

Tuesday, May 9th, 2017 by kc

[Executive summary and link below]

The CAIDA annual report summarizes CAIDA’s activities for 2016, in the areas of research, infrastructure, data collection and analysis. Our research projects span Internet topology, routing, security, economics, future Internet architectures, and policy. Our infrastructure, software development, and data sharing activities support measurement-based internet research, both at CAIDA and around the world, with focus on the health and integrity of the global Internet ecosystem. The executive summary is excerpted below:

Mapping the Internet. We continued to expand our topology mapping capabilities using our Ark measurement infrastructure. We improved the accuracy and sophistication of our topology annotations, including classification of ISPs, business relationships between them, and geographic mapping of interdomain links that implement these relationships. We released two Internet Topology Data Kits (ITDKs) incorporating these advances.

Mapping Interconnection Connectivity and Congestion. We continued our collaboration with MIT to map the rich mesh of interconnection in the Internet in order to study congestion induced by evolving peering and traffic management practices of CDNs and access ISPs. We focused our efforts on the challenge of detecting and localizing congestion to specific points in between networks. We developed new tools to scale measurements to a much wider set of available nodes. We also implemented a new database and graphing platform to allow us to interactively explore our topology and performance measurements. We produced related data collection and analyses to enable evaluation of these measurements in the larger context of the evolving ecosystem: infrastructure resiliency, economic tussles, and public policy.

Monitoring Global Internet Security and Stability. We conducted infrastructure research and development projects that focus on security and stability aspects of the global Internet. We developed continuous fine-grained monitoring capabilities establishing a baseline connectivity awareness against which to interpret observed changes due to network outages or route hijacks. We released (in beta form) a new operational prototype service that monitors the Internet, in near-real-time, and helps identify macroscopic Internet outages affecting the edge of the network.

CAIDA also developed new client tools for measuring IPv4 and IPv6 spoofing capabilities, along with services that provide reporting and allow users to opt-in or out of sharing the data publicly.

Future Internet Architectures. We continued studies of IPv4 and IPv6 paths in the Internet, including topological congruency, stability, and RTT performance. We examined the state of security policies in IPv6 networks, and collaborated to measure CGN deployment in U.S. broadband networks. We also continued our collaboration with researchers at several other universities to advance development of a new Internet architecture: Named Data Networking (NDN) and published a paper on the policy and social implications of an NDN-based Internet.

Public Policy. Acting as an Independent Measurement Expert, we posted our agreed-upon revised methodology for measurement methods and reporting requirements related to AT&T Inc. and DirecTV merger (MB Docket No. 14-90). We published our proposed method and a companion justification document. Inspired by this experience and a range of contradicting claims about interconnection performance, we introduced a new model describing measurements of interconnection links of access providers, and demonstrated how it can guide sound interpretation of interconnection-related measurements regardless of their source.

Infrastructure operations. It was an unprecedented year for CAIDA from an infrastructure development perspective. We continued support for our existing active and passive measurement infrastructure to provide visibility into global Internet behavior, and associated software tools and platforms that facilitate network research and operational assessments.

We made available several data services that have been years in the making: our prototype Internet Outage Detection and Analysis service, with several underlying components released as open source; the Periscope platform to unify and scale querying of thousands of looking glass nodes on the global Internet; our large-scale Internet topology query system (Henya); and our Spoofer system for measurement and analysis of source address validation across the global Internet. Unfortunately, due to continual network upgrades, we lost access to our 10GB backbone traffic monitoring infrastructure. Now we are considering approaches to acquire new monitors capable of packet capture on 100GB links.

As always, we engaged in a variety of tool development, and outreach activities, including maintaining web sites, publishing 13 peer-reviewed papers, 3 technical reports, 4 workshop reports, one (our first) BGP hackathon report, 31 presentations, 20 blog entries, and hosting 6 workshops (including the hackathon). This report summarizes the status of our activities; details about our research are available in papers, presentations, and interactive resources on our web sites. We also provide listings and links to software tools and data sets shared, and statistics reflecting their usage. Finally, we report on web site usage, personnel, and financial information, to provide the public a better idea of what CAIDA is and does.

For the full 2016 annual report, see http://www.caida.org/home/about/annualreports/2016/

The Remote Peering Jedi

Friday, November 11th, 2016 by Josh Polterock

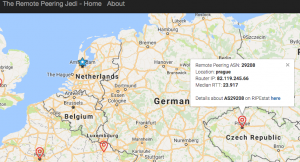
During the RIPE 73 IXP Tools Hackathon, Vasileios Giotsas, working with collaborators at FORTH/University of Crete, AMS-IX, University College, London, and NFT Consult, created the Remote Peering Jedi Tool to provide a view into the remote peering ecosystem. Given a large and diverse corpus of traceroute data, the tool detects and localizes remote peering at Internet Exchange Points (IXP).

To make informed decisions, researchers and operators desire to know who has remote peering at the various IXPs. For their RIPE hackathon project, the group created a tool to automate the detection using average RTTs from the RIPE Atlas’ massive corpus of traceroute paths. The group collected validation data from boxes inside the three large IXPs to compare to RTTs estimated via Atlas. The data suggests possible opportunities for Content Distribution Networks (CDN) to improve services for smaller IXPs. The project results also offer insights into how to interpret some of the information in PeeringDB. The project further examined how presence-informed RTT geolocation can contribute to identifying the location of resources. These results help reduce the problem space by exploiting the fact that the IP space of a given AS can appear where the AS has presence.

For more details, you can watch Vasileios’ presentation of the Remote Peering Jedi Tool. Or, visit the remote peering portal to see the tool in action.

remote-peering-jedi

CAIDA’s 2015 Annual Report

Tuesday, July 19th, 2016 by kc

[Executive summary and link below]

The CAIDA annual report summarizes CAIDA’s activities for 2015, in the areas of research, infrastructure, data collection and analysis. Our research projects span Internet topology, routing, security, economics, future Internet architectures, and policy. Our infrastructure, software development, and data sharing activities support measurement-based internet research, both at CAIDA and around the world, with focus on the health and integrity of the global Internet ecosystem. The executive summary is excerpted below:

Mapping the Internet. We continued to pursue Internet cartography, improving our IPv4 and IPv6 topology mapping capabilities using our expanding and extensible Ark measurement infrastructure. We improved the accuracy and sophistication of our topology annotation capabilities, including classification of ISPs and their business relationships. Using our evolving IP address alias resolution measurement system, we collected curated, and released another Internet Topology Data Kit (ITDK).

Mapping Interconnection Connectivity and Congestion.
We used the Ark infrastructure to support an ambitious collaboration with MIT to map the rich mesh of interconnection in the Internet, with a focus on congestion induced by evolving peering and traffic management practices of CDNs and access ISPs, including methods to detect and localize the congestion to specific points in networks. We undertook several studies to pursue different dimensions of this challenge: identification of interconnection borders from comprehensive measurements of the global Internet topology; identification of the actual physical location (facility) of an interconnection in specific circumstances; and mapping observed evidence of congestion at points of interconnection. We continued producing other related data collection and analysis to enable evaluation of these measurements in the larger context of the evolving ecosystem: quantifying a given ISP’s global routing footprint; classification of autonomous systems (ASes) according to business type; and mapping ASes to their owning organizations. In parallel, we examined the peering ecosystem from an economic perspective, exploring fundamental weaknesses and systemic problems of the currently deployed economic framework of Internet interconnection that will continue to cause peering disputes between ASes.

Monitoring Global Internet Security and Stability. We conduct other global monitoring projects, which focus on security and stability aspects of the global Internet: traffic interception events (hijacks), macroscopic outages, and network filtering of spoofed packets. Each of these projects leverages the existing Ark infrastructure, but each has also required the development of new measurement and data aggregation and analysis tools and infrastructure, now at various stages of development. We were tremendously excited to finally finish and release BGPstream, a software framework for processing large amounts of historical and live BGP measurement data. BGPstream serves as one of several data analysis components of our outage-detection monitoring infrastructure, a prototype of which was operating at the end of the year. We published four other papers that either use or leverage the results of internet scanning and other unsolicited traffic to infer macroscopic properties of the Internet.

Future Internet Architectures. The current TCP/IP architecture is showing its age, and the slow uptake of its ostensible upgrade, IPv6, has inspired NSF and other research funding agencies around the world to invest in research on entirely new Internet architectures. We continue to help launch this moonshot from several angles — routing, security, testbed, management — while also pursuing and publishing results of six empirical studies of IPv6 deployment and evolution.

Public Policy. Our final research thrust is public policy, an area that expanded in 2015, due to requests from policymakers for empirical research results or guidance to inform industry tussles and telecommunication policies. Most notably, the FCC and AT&T selected CAIDA to be the Independent Measurement Expert in the context of the AT&T/DirecTV merger, which turned out to be as much of a challenge as it was an honor. We also published three position papers each aimed at optimizing different public policy outcomes in the face of a rapidly evolving information and communication technology landscape. We contributed to the development of frameworks for ethical assessment of Internet measurement research methods.

Our infrastructure operations activities also grew this year. We continued to operate active and passive measurement infrastructure with visibility into global Internet behavior, and associated software tools that facilitate network research and security vulnerability analysis. In addition to BGPstream, we expanded our infrastructure activities to include a client-server system for allowing measurement of compliance with BCP38 (ingress filtering best practices) across government, research, and commercial networks, and analysis of resulting data in support of compliance efforts. Our 2014 efforts to expand our data sharing efforts by making older topology and some traffic data sets public have dramatically increased use of our data, reflected in our data sharing statistics. In addition, we were happy to help launch DHS’ new IMPACT data sharing initiative toward the end of the year.

Finally, as always, we engaged in a variety of tool development, and outreach activities, including maintaining web sites, publishing 27 peer-reviewed papers, 3 technical reports, 3 workshop reports, 33 presentations, 14 blog entries, and hosting 5 workshops. This report summarizes the status of our activities; details about our research are available in papers, presentations, and interactive resources on our web sites. We also provide listings and links to software tools and data sets shared, and statistics reflecting their usage. sources. Finally, we offer a “CAIDA in numbers” section: statistics on our performance, financial reporting, and supporting resources, including visiting scholars and students, and all funding sources.

For the full 2015 annual report, see http://www.caida.org/home/about/annualreports/2015/

1st CAIDA BGP Hackathon brings students and community experts together

Thursday, February 18th, 2016 by Josh Polterock

We set out to conduct a social experiment of sorts, to host a hackathon to hack streaming BGP data. We had no idea we would get such an enthusiastic reaction from the community and that we would reach capacity. We were pleasantly surprised at the response to our invitations when 25 experts came to interact with 50 researchers and practitioners (30 of whom were graduate students). We felt honored to have participants from 15 countries around the world and experts from companies such as Cisco, Comcast, Google, Facebook and NTT, who came to share their knowledge and to help guide and assist our challenge teams.

Having so many domain experts from so many institutions and companies with deep technical understanding of the BGP ecosystem together in one room greatly increased the kinetic potential for what we might accomplish over the course of our two days.

(more…)

RFC 7514 : Really Explicit Congestion Notification (RECN)

Wednesday, April 1st, 2015 by kc

I feel that somewhere up there Jon Postel is smiling about Matthew’s RFC 7514, published today:

The deployment of Explicit Congestion Notification (ECN) [RFC3168] remains stalled. While most operating systems support ECN, it is currently disabled by default because of fears that enabling ECN will break transport protocols. This document proposes a new ICMP message that a router or host may use to advise a host to reduce the rate at which it sends, in cases where the host ignores other signals such as packet loss and ECN. We call this message the “Really Explicit Congestion Notification” (RECN) message because it delivers a less subtle indication of congestion than packet loss and ECN.

http://www.rfc-editor.org/rfc/rfc7514.txt

NSF Future Internet Architecture (Next Phase) PI Meeting

Thursday, June 5th, 2014 by Josh Polterock

On 19-20 May 2014, the NSF Computer and Network Systems (CNS) Core Programs hosted a kickoff meeting in Washington D.C. for the next phase of the Future Internet Architectures Program. The program funds three projects for an additional two years each to create and demonstrate prototype implementations of their architecture protocol suites and test and evaluate them in one or more relevant application environments. The meeting allowed the projects to present overviews of their architectures and the environments in which they plan to test them, as well as their thoughts on how their architecture may shift the balance of power among players in the Internet ecosystem, and other ideas on how to evaluate their architecture’s benefits and incentives to deploy. CAIDA participates in the Named-Data Networking Project (NDN), one of the three projects that receive funding from the FIA NP Program. The NDN team’s presentations at this meeting are posted at http://named-data.net/publications/presentations/.

Twelve Years in the Evolution of the Internet Ecosystem

Tuesday, April 10th, 2012 by Amogh Dhamdhere

Our recent study of the evolution of the Internet ecosystem over the last twelve years (1998-2010) appeared in the IEEE/ACM Transactions on Networking in October 2011. Why is the Internet an ecosystem? The Internet, commonly described as a network of networks, consists of thousands of Autonomous Systems (ASes) of different sizes, functions, and business objectives that interact to provide the end-to-end connectivity that end users experience. ASes engage in transit (or customer-provider) relations, and also in settlement-free peering relations. These relations, which appear as inter domain links in an AS topology graph, indicate the transfer of not only traffic but also economic value between ASes. The Internet AS ecosystem is highly dynamic, experiencing growth (birth of new ASes), rewiring (changes in the connectivity of existing ASes), as well as deaths (of existing ASes). The dynamics of the AS ecosystem are determined both by external business environment factors (such as the state of the global economy or the popularity of new Internet applications) and by complex incentives and objectives of each AS. Specifically, ASes attempt to optimize their utility or financial gains by dynamically changing, directly or indirectly, the ASes they interact with.

The goal of our study was to better understand this complex ecosystem, the behavior of entities that constitute it (ASes), and the nature of interactions between those entities (AS links). How has the Internet ecosystem been growing? Is growth a more significant factor than rewiring in the formation of new links? Is the population of transit providers increasing (implying diversification of the transit market) or decreasing (consolidation of the transit market)? As the Internet grows in its number of nodes and links, does the average AS-path length also increase? Which ASes engage in aggressive multihoming? Which ASes are especially active, i.e., constantly adjust their set of providers? Are there regional differences in how the Internet evolves?

(more…)