Archive for the 'Measurement' Category

CAIDA’s 2023 Annual Report

Wednesday, October 23rd, 2024 by kc

The CAIDA annual report (quite a bit later than usual this year due to an unprecedented level of activity in 2024 which we will report on earlier next year!) summarizes CAIDA’s activities for 2023 in the areas of research, infrastructure, data collection and analysis. The executive summary is excerpted below:
(more…)

Towards a Domain Specific Language for Internet Active Measurement

Tuesday, January 16th, 2024 by Matthew Luckie

This is the first in a series of essays about CAIDA’s new effort to reduce the barrier to performing a variety of Internet measurements.

Network operators and researchers often require the ability to conduct active measurements of networks from a specific location in order to understand some property of the network. However, obtaining access to a vantage point at a given location is challenging, as there can be significant trust barriers that prevent access: a platform operator has to provide vantage point hosts with guarantees about the activity that their vantage points will exhibit, and a platform operator has to trust that users will stay within those guarantees. Current access control to active measurement infrastructure has two extremes: access that allows for trusted users to run arbitrary code, and API access that allows arbitrary users to schedule a (limited) set of measurements, and obtain their results. Prior research thrusts in active measurement design have focused on interfaces that allow a user to request a host to send arbitrary packets, leaving the implementation of the measurement to the user. However, this design pattern limits the guarantees that a platform operator can provide a vantage point host regarding what their vantage point will actually do. A domain-specific language for conducting active measurements can alleviate these concerns because it (1) allows a platform operator to specify the measurements that a user can run, and communicate to the host what their vantage point will do, (2) provides users reference implementations of measurement applications that act as building blocks to more complex measurements.

Over the past six months, in consultation with members of the active measurement community, CAIDA has been working towards a next-generation measurement infrastructure, built on the existing Archipelago (Ark) platform. One aspect of this platform is the notion of a researcher development environment that allows for complex, distributed, and reactive measurements built on a well-defined set of measurement primitives. In an effort to make the Ark platform easier to use for measurement researchers, while also providing important access control, CAIDA has developed the scamper python module that provides an interface to the measurement primitives available on each of the Ark nodes. Today, we are releasing the source code of that module, so that researchers can develop and test complex measurements locally, before running vetted experiments on Ark.
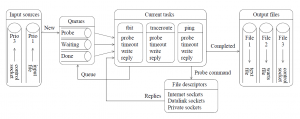
Scamper architecture chart

The architecture of scamper. Measurement tasks are supplied from one or more input sources, including from an input file, from the command line, or from a control socket.

The module provides user-friendly interfaces to existing scamper functionality. We illustrate the module with some examples.

Example #1: Implementation of RTT-based geolocation measurement

The following is an implementation of the well-known single-radius measurement, which conducts delay measurements to an IP address from a distributed set of vantage points, and reports the shortest of all the RTTs obtained with the name of the monitor, which on Ark, is derived from its location (e.g., lax-us, hlz2-nz, ams-nl, and so on). Researchers and operators might use this technique to understand approximately where a system is located, using the RTT constraint of the vantage point that reports the shortest delay.

01 import sys
02 from datetime import timedelta
03 from scamper import ScamperCtrl
04
05 if len(sys.argv) != 3:
06   print("usage: single-radius.py $dir $ip")
07   sys.exit(-1)
08
09 ctrl = ScamperCtrl(remote_dir=sys.argv[1])
10 for i in ctrl.instances():
11   ctrl.do_ping(sys.argv[2], inst=i)
12
13 min_rtt = None
14 min_vp = None
15 for o in ctrl.responses(timeout=timedelta(seconds=10)):
16   if o.min_rtt is not None and (min_rtt is None or min_rtt > o.min_rtt):
17     min_rtt = o.min_rtt
18     min_vp = o.inst
19
20 if min_rtt is not None:
21   print(f"{min_vp.name} {(min_rtt.total_seconds()*1000):.1f} ms")
22 else:
23   print(f"no responses for {sys.argv[2]}")

This implementation takes two parameters (lines 5-7) — a directory that contains a set of unix domain sockets, each of which represents an interface to a single vantage point, and an IP address to probe. On line 9, we open an interface (represented by a ScamperCtrl object) that contains all of the vantage points in that directory. We then send a ping measurement to each of the vantage point instances (lines 10-11). These ping measurements operate in parallel — the ping measurements on each of the nodes operate asynchronously. We then collect the results of the measurements (lines 13-18), noting the minimum observed RTT, and the vantage point where it came from. We pass a 10-second timeout on line 15, so that a vantage point that experiences an outage after we send the measurements does not hold up the whole experiment. Finally, on lines 20-23, we print the result of the measurement.

Example #2: RTTs to authoritative name servers of a specific domain

The next example shows a more complex measurement. Let’s say we want to know the RTTs to the authoritative name servers for a zone from a single vantage point.

01 import sys
02 from datetime import timedelta
03 from scamper import ScamperCtrl
04
05 if len(sys.argv) != 3:
06   print("usage: authns-delay.py $vp $zone")
07   sys.exit(-1)
08
09 ctrl = ScamperCtrl(remote=sys.argv[1])
10
11 # get the list of NS for the zone
12 o = ctrl.do_dns(sys.argv[2], qtype='NS', wait_timeout=1, sync=True)
13
14 # issue queries for the IP addresses of the authoritative servers
15 ns = {}
16 for rr in o.ans():
17   if rr.ns is not None and rr.ns not in ns:
18     ns[rr.ns] = 1
19     ctrl.do_dns(rr.ns, qtype='A', wait_timeout=1)
20     ctrl.do_dns(rr.ns, qtype='AAAA', wait_timeout=1)
21
22 # collect the unique addresses out of the address lookups
23 addr = {}
24 for o in ctrl.responses(timeout=timedelta(seconds=3)):
25   for a in o.ans_addrs():
26     addr[a] = o.qname
27
28 # collect RTTs for the unique IP addresses
29 for a in addr:
30   ctrl.do_ping(a)
31 for o in ctrl.responses(timeout=timedelta(seconds=10)):
32   print(f"{addr[o.dst]} {o.dst} " +
33         (f"{(o.min_rtt.total_seconds() * 1000):.1f}"
34          if o.min_rtt is not None else "???"))

This implementation takes two parameters (lines 5-7) — a single vantage point, and a zone name to study. As before, we open an interface to that VP on line 9, and then issue a DNS query for the authoritative name servers for the zone (line 12).

There are a couple of interesting things to note about line 12. First, we do not pass a handle representing the VP instance to the do_dns method, as the ScamperCtrl interface only has a single instance associated with it — it is smart enough to use that single instance for the measurement. Second, we pass sync=True to make the measurement synchronous — the method does not return until it has the results of that single measurement. This is shorter (in lines of code) and more readable than issuing an asynchronous measurement and then collecting the single result. Then, we issue asynchronous queries for the IPv4 and IPv6 addresses for the name servers returned (lines 14-20) and send ping measurements for each of the addresses (lines 29-30). Finally, we print the names of the nameservers, their IP addresses, and the minimum RTT observed to each.

The scamper python module supports most of the measurement primitives currently available in scamper: ping, traceroute, DNS query, alias resolution, HTTP, and simple UDP probes. We’ve used the module internally to: (1) reproduce the data collection methodology of a recent router fingerprinting method; (2) study the deployment of Netflix fast.com speed test endpoints, (3) implement MIDAR; (4) study anycast open resolvers, and (5) monitor serial number changes of zones amongst a set of nameservers authoritative for a zone. One important feature of our module is that it provides a python interface, which means that you can use our measurement module alongside existing python modules that parse JSON, etc. The documentation for the module is publicly available and we will write additional blog entries in the coming days that show more of its features, in a digestible form.

In the short term, measurement researchers can request access to the infrastructure to run vetted experiments by emailing ark-info at caida.org. Note: the access does not provide a login on any of the Ark nodes. Rather, it provides access to a system that can access the measurement primitives of the vantage points, as illustrated above. Again, we are releasing the python module to allow researchers to develop and debug experiments locally, before running them on Ark. We hope that this approach provides a convenient development lifecycle for researchers, as the CAIDA system you will have access to when running the experiments will not necessarily have the local development environment that you are accustomed to.

The module itself is written in cython, providing a wrapper around two C libraries in scamper that do much of the heavy lifting. You build and install the module using the instructions on the scamper website, install the module using the Ubuntu PPA (preferred if you are using Ubuntu), or install the module using one of the packages available on other operating systems as these become available.

CAIDA’s 2022 Annual Report

Monday, July 10th, 2023 by kc

The CAIDA annual report summarizes CAIDA’s activities for 2022 in the areas of research, infrastructure, data collection and analysis. The executive summary is excerpted below:
(more…)

Unintended consequences of submarine cable deployment on Internet routing

Tuesday, December 15th, 2020 by Roderick Fanou

Figure 1: This picture shows a line of floating buoys that designate the path of the long-awaited SACS (South-Atlantic Cable System). This submarine cable now connects Angola to Brazil (Source: G Massala, https://www.menosfios.com/en/finally-cable-submarine-sacs-arrived-to-brazil/, Feb 2018.)

The network layer of the Internet routes packets regardless of the underlying communication media (Wifi, cellular telephony, satellites, or optical fiber). The underlying physical infrastructure of the Internet includes a mesh of submarine cables, generally shared by network operators who purchase capacity from the cable owners [2,11]. As of late 2020, over 400 submarine cables interconnect continents worldwide and constitute the oceanic backbone of the Internet. Although they carry more than 99% of international traffic, little academic research has occurred to isolate end-to-end performance changes induced by their launch.

In mid-September 2018, Angola Cables (AC, AS37468) activated the SACS cable, the first trans-Atlantic cable traversing the Southern hemisphere [1][A1]. SACS connects Angola in Africa to Brazil in South America. Most assume that the deployment of undersea cables between continents improves Internet performance between the two continents. In our paper, “Unintended consequences: Effects of submarine cable deployment on Internet routing”, we shed empirical light on this hypothesis, by investigating the operational impact of SACS on Internet routing. We presented our results at the Passive and Active Measurement Conference (PAM) 2020, where the work received the best paper award [11,7,8]. We summarize the contributions of our study, including our methodology, data collection and key findings.

[A1]  Note that in the same year, Camtel (CM, AS15964), the incumbent operator of Cameroon, and China Unicom (CH, AS9800) deployed the 5,900km South Atlantic Inter Link (SAIL), which links Fortaleza to Kribi (Cameroon) [17], but this cable was not yet lit as of March 2020.

(more…)

Effects of submarine cables deployment on Internet routing: CAIDA wins Best Paper at PAM 2020!

Tuesday, April 21st, 2020 by Roderick Fanou

Congratulations to Roderick Fanou, Bradley Huffaker, Ricky Mok, and kc claffy, for being awarded Best Paper at the Passive and Active Network Measurement Conference PAM 2020!

The abstract from the paper, “Unintended Consequences: Effects of submarine cables deployment on Internet routing“:

We use traceroute and BGP data from globally distributed Internet measurement infrastructures to study the impact of a noteworthy submarine cable launch connecting Africa to South America. We leverage archived data from RIPE Atlas and CAIDA Ark platforms, as well as custom measurements from strategic vantage points, to quantify the differences in end-to-end latency and path lengths before and after deployment of this new South-Atlantic cable. We find that ASes operating in South America significantly benefit from this new cable, with reduced latency to all measured African countries. More surprising is that end-to-end latency to/from some regions of the world, including intra-African paths towards Angola, increased after switching to the cable. We track these unintended consequences to suboptimally circuitous IP paths that traveled from Africa to Europe, possibly North America, and South America before traveling back to Africa over the cable. Although some suboptimalities are expected given the lack of peering among neighboring ASes in the developing world, we found two other causes: (i) problematic intra-domain routing within a single Angolese network, and (ii) suboptimal routing/traffic engineering by its BGP neighbors. After notifying the operating AS of our results, we found that most of these suboptimalities were subsequently resolved. We designed our method to generalize to the study of other cable deployments or outages and share our code to promote reproducibility and extension of our work

The study presents a reproducible method to investigate the impact of a cable deployment on the macroscopic Internet topology and end-to-end performance. We then applied our methodology to the case of SACS (South-Atlantic Cable System), the first South-Atlantic cable from South America to Africa, using historical traceroutes from both Archipelago (Ark) and RIPE Atlas measurement platforms, BGP data, etc.

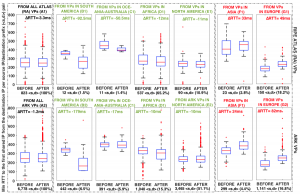
Boxplots of minimum RTTs from Ark and Atlas Vantage Points to the common IP hops closest to the destination IPs. Sets BEFORE and AFTER correspond to periods pre and post-SACS deployment. We present ∆RTT (AFTER minus BEFORE) per sub-figure. RTT changes are similar across measurement platforms. Paths from South America experienced a median RTT decrease of 38%, those from Oceania-Australia a smaller decrease of 8%, while those from Africa and North America, roughly 3%. Conversely, paths from Europe and Asia that crossed SACS after its deployment experienced an average RTT increase of 40% and 9%, respectively.

As shown in the above figure, our findings included:

  • the median RTT decrease from Africa to Brazil was roughly a third of that from South America to Angola
  • surprising performance degradations to/from some regions worldwide, e.g., Asia and Europe.

We also offered suggestions for how to avoid suboptimal routing that gives rise to such performance degradations post-activation of cables in the future. They could:

  • Inform their BGP neighbours to allow time for changes
  • Ensure optimal iBGP configs post-activation
  • Use measurements platforms to verify path optimality

To enable reproducibility of this work, we made our tools and publicly accessible on GitHub.

Read the full paper on the CAIDA website or watch the PAM presentation video on YouTube.

CAIDA’s Annual Report for 2018

Tuesday, May 7th, 2019 by kc

The CAIDA annual report summarizes CAIDA’s activities for 2018, in the areas of research, infrastructure, data collection and analysis. Our research projects span Internet topology, routing, security, economics, future Internet architectures, and policy. Our infrastructure, software development, and data sharing activities support measurement-based internet research, both at CAIDA and around the world, with focus on the health and integrity of the global Internet ecosystem. The executive summary is excerpted below:
(more…)

9th Workshop on Internet Economics

Tuesday, January 29th, 2019 by kc

On December 12-13, 2018, CAIDA and the Massachusetts Institute of Technology (MIT) hosted the (invitation-only) 9th interdisciplinary Workshop on Internet Economics (WIE) at the University of California San Diego in La Jolla, CA.

The goal of this workshop series is to provide a forum for researchers, commercial Internet facilities and service providers, technologists, economists, theorists, policy makers, and other stakeholders to empirically inform emerging Internet regulatory and policy debates.

Presenters were asked to write talk abstracts on their presented topics, addressing four questions:

  1. What is the policy goal or fear you’re addressing?
  2. What data is needed to measure progress toward/away from this goal fear?
  3. What methods do you propose (or are) being used to gather such data?
  4. Who/how should such methods be executed, and the data shared, or not shared?

With a specific focus on measurement challenges, the topics we discussed included: analyzing the evolution of the Internet in a layered-platform context to gain new insights; measurement and analysis of economic impacts of new technologies using old tools; security and trustworthiness, reach (universal service) and reachability, sustainability of investment into public Internet infrastructure, as well as infrastructure to measure the public Internet.

Some of the takeaways from the workshop included:
(more…)

CAIDA’s Annual Report for 2017

Tuesday, May 29th, 2018 by kc

The CAIDA annual report summarizes CAIDA’s activities for 2017, in the areas of research, infrastructure, data collection and analysis. Our research projects span Internet topology, routing, security, economics, future Internet architectures, and policy. Our infrastructure, software development, and data sharing activities support measurement-based internet research, both at CAIDA and around the world, with focus on the health and integrity of the global Internet ecosystem. The executive summary is excerpted below:
(more…)

CAIDA’s 2016 Annual Report

Tuesday, May 9th, 2017 by kc

[Executive summary and link below]

The CAIDA annual report summarizes CAIDA’s activities for 2016, in the areas of research, infrastructure, data collection and analysis. Our research projects span Internet topology, routing, security, economics, future Internet architectures, and policy. Our infrastructure, software development, and data sharing activities support measurement-based internet research, both at CAIDA and around the world, with focus on the health and integrity of the global Internet ecosystem. The executive summary is excerpted below:

Mapping the Internet. We continued to expand our topology mapping capabilities using our Ark measurement infrastructure. We improved the accuracy and sophistication of our topology annotations, including classification of ISPs, business relationships between them, and geographic mapping of interdomain links that implement these relationships. We released two Internet Topology Data Kits (ITDKs) incorporating these advances.

Mapping Interconnection Connectivity and Congestion. We continued our collaboration with MIT to map the rich mesh of interconnection in the Internet in order to study congestion induced by evolving peering and traffic management practices of CDNs and access ISPs. We focused our efforts on the challenge of detecting and localizing congestion to specific points in between networks. We developed new tools to scale measurements to a much wider set of available nodes. We also implemented a new database and graphing platform to allow us to interactively explore our topology and performance measurements. We produced related data collection and analyses to enable evaluation of these measurements in the larger context of the evolving ecosystem: infrastructure resiliency, economic tussles, and public policy.

Monitoring Global Internet Security and Stability. We conducted infrastructure research and development projects that focus on security and stability aspects of the global Internet. We developed continuous fine-grained monitoring capabilities establishing a baseline connectivity awareness against which to interpret observed changes due to network outages or route hijacks. We released (in beta form) a new operational prototype service that monitors the Internet, in near-real-time, and helps identify macroscopic Internet outages affecting the edge of the network.

CAIDA also developed new client tools for measuring IPv4 and IPv6 spoofing capabilities, along with services that provide reporting and allow users to opt-in or out of sharing the data publicly.

Future Internet Architectures. We continued studies of IPv4 and IPv6 paths in the Internet, including topological congruency, stability, and RTT performance. We examined the state of security policies in IPv6 networks, and collaborated to measure CGN deployment in U.S. broadband networks. We also continued our collaboration with researchers at several other universities to advance development of a new Internet architecture: Named Data Networking (NDN) and published a paper on the policy and social implications of an NDN-based Internet.

Public Policy. Acting as an Independent Measurement Expert, we posted our agreed-upon revised methodology for measurement methods and reporting requirements related to AT&T Inc. and DirecTV merger (MB Docket No. 14-90). We published our proposed method and a companion justification document. Inspired by this experience and a range of contradicting claims about interconnection performance, we introduced a new model describing measurements of interconnection links of access providers, and demonstrated how it can guide sound interpretation of interconnection-related measurements regardless of their source.

Infrastructure operations. It was an unprecedented year for CAIDA from an infrastructure development perspective. We continued support for our existing active and passive measurement infrastructure to provide visibility into global Internet behavior, and associated software tools and platforms that facilitate network research and operational assessments.

We made available several data services that have been years in the making: our prototype Internet Outage Detection and Analysis service, with several underlying components released as open source; the Periscope platform to unify and scale querying of thousands of looking glass nodes on the global Internet; our large-scale Internet topology query system (Henya); and our Spoofer system for measurement and analysis of source address validation across the global Internet. Unfortunately, due to continual network upgrades, we lost access to our 10GB backbone traffic monitoring infrastructure. Now we are considering approaches to acquire new monitors capable of packet capture on 100GB links.

As always, we engaged in a variety of tool development, and outreach activities, including maintaining web sites, publishing 13 peer-reviewed papers, 3 technical reports, 4 workshop reports, one (our first) BGP hackathon report, 31 presentations, 20 blog entries, and hosting 6 workshops (including the hackathon). This report summarizes the status of our activities; details about our research are available in papers, presentations, and interactive resources on our web sites. We also provide listings and links to software tools and data sets shared, and statistics reflecting their usage. Finally, we report on web site usage, personnel, and financial information, to provide the public a better idea of what CAIDA is and does.

For the full 2016 annual report, see http://www.caida.org/home/about/annualreports/2016/

Why IP source address spoofing is a problem and how you can help.

Friday, March 24th, 2017 by Bradley Huffaker

video: http://www.caida.org/publications/animations/security/spoofer-sav-intro
information: Software Systems for Surveying Spoofing Susceptibility
download: https://spoofer.caida.org/

This material is based on research sponsored by the Department of Homeland Security (DHS) Science and Technology Directorate, Homeland Security Advanced Research Projects Agency, Cyber Security Division (DHS S&T/HSARPA/CSD) BAA HSHQDC-14-R-B0005, and the Government of United Kingdom of Great Britain and Northern Ireland via contract number D15PC00188. Views should not be interpreted as necessarily representing the official policies or endorsements, either expressed or implied, of Department of Homeland Security, the U.S. Government, or the Government of United Kingdom of Great Britain and Northern Ireland.