Archive for the 'Commentaries' Category

What’s in a Ranking? comparing Dyn’s Baker’s Dozen and CAIDA’s AS Rank

Thursday, July 2nd, 2015 by Bradley Huffaker

The Internet infrastructure is composed of thousands of independent networks (Autonomous Systems, or ASes) that engage in typically voluntary bilateral interconnection (“peering”) agreements to provide reachability to each other. Underlying these peering relationships, are business relationships between networks, although whether and how much money ASes exchange when they interconnect is not generally published. Some of these business relationships are relatively easy to infer with a high degree of confidence using a basic economic assumption that commercial providers do not give away traffic transit services (i.e., route announcements) for free.

For several years CAIDA has used publicly available BGP data to infer business relationships among ASes and, consequently, rank Autonomous Systems based on a measure of their influence in the global routing system, specifically the size of their customer cone. (An AS’s customer cone is the set of ASes, IPv4 prefixes, or IPv4 addresses that the AS can reach via its customers, i.e., by crossing only customer links.) The methodology behind our ranking is described in detail in our IMC2013 paper (“AS Relationships, Customer Cones, and Validation”). By default, CAIDA’s AS Rank sorts by the number of other ASes in each AS’s customer cone (an AS granularity), but the AS Rank web interface also supports sorting by the number of IPv4 prefixes or IPv4 addresses observed in each AS’s customer cone (which the web interface calls prefix or IP address granularities).

Other organizations also provide rankings of ASes; the most well-known is Dyn’s IP Transit Intelligence AS ranking. Since both CAIDA’s and Dyn’s rankings aim to use a metric that reflects some notion of “predominant role in the global Internet routing system”, we have received several inquiries on how our ranking methodology and results differ from theirs. In this essay we try to answer this question to the best of our ability, acknowledging that their methodology is proprietary and we do not know exactly what they are doing beyond what they have released publicly. This 2013 MENOG presentation (Dyn bought the Renesys company in 2014) states that their ranking is based on quantity of transited IP space, so the closest possible comparison to what we currently do would be to compare their ranking with our IP-address-based customer cone ranking (which is not currently our default). For this exercise we will compare CAIDA’s 1st January 2015 AS ranking by customer cone with the chronologically last value on Dyn’s 2014 Baker’s Dozen, which is based on data observed around the same date.

Dyn’s web site provides the following image showing their rankings throughout 2014: Dyn-Bakers-Dozen-2014-All
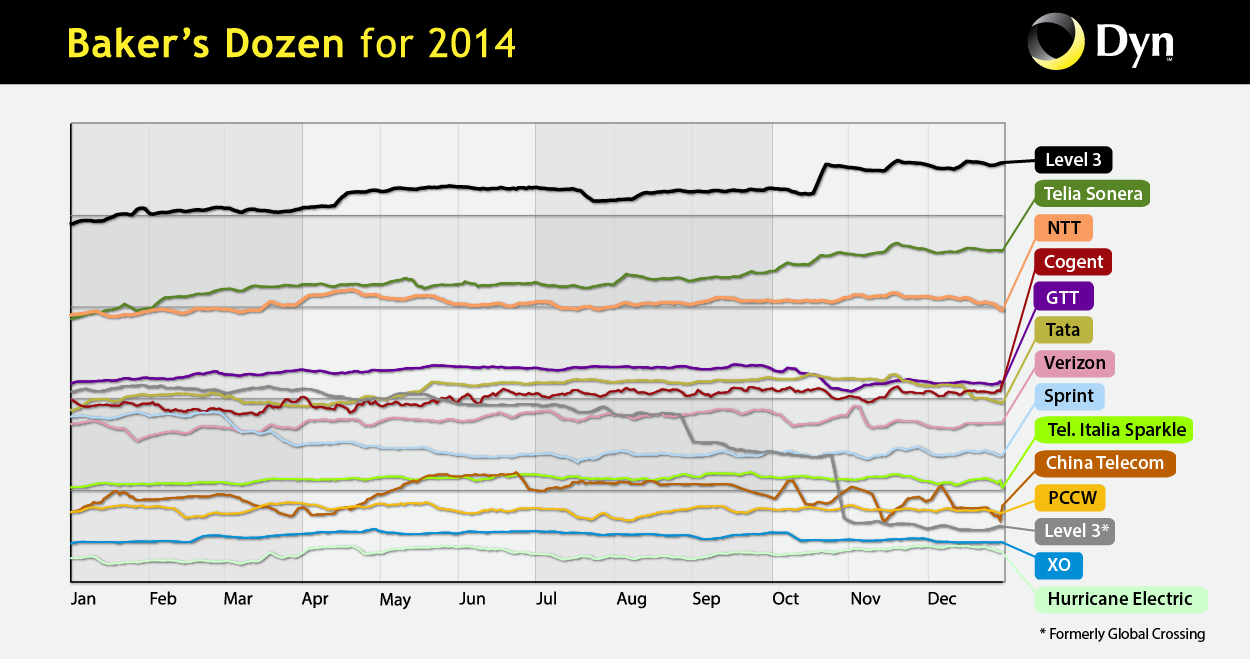
In order to compare not only the computed ranking, but the values of the metrics being ranked (i.e., transited IPv4 space vs. number of addresses in customer cone), we create a mapping between the two spaces. Dyn does not put numbers on their y-axis, and they plot only the top 13 ranked ASes, so we do not know the range of y-values represented. In order to make the comparison possible, we will (make a leap of faith and) assume that the top thirteen ranked ASes for each metric cover roughly the same rank of values. (We caution that this assumption may be unjustified and are trying to validate it with Dyn.) So we map the top ranked ASes in Dyn (Level 3 AS3356), to the top ranked AS in CAIDA (also Level 3 AS3356), and map the 13th-ranked AS in Dyn, (Hurricane AS6939), to the 13th ranked AS in CAIDA, (Korea Telecom AS4766). These upper and lower thresholds result in the following mapping between the transited IPv4 space and number of IPv4 addresses in customer cone:

ASdyn_i.dyn_y = ASdyn_i.transit_ip – ASdyn_13.transit_ip + AScaida_13.number_addresses
AScaida_0.num_addresses – AScaida_13.num_addresses

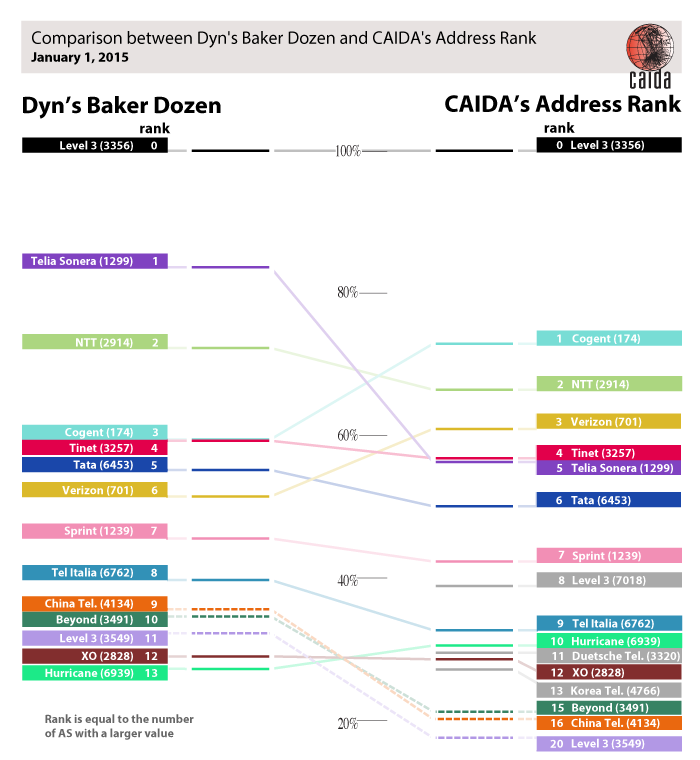
Dyn vs CAIDA's AS Ranking
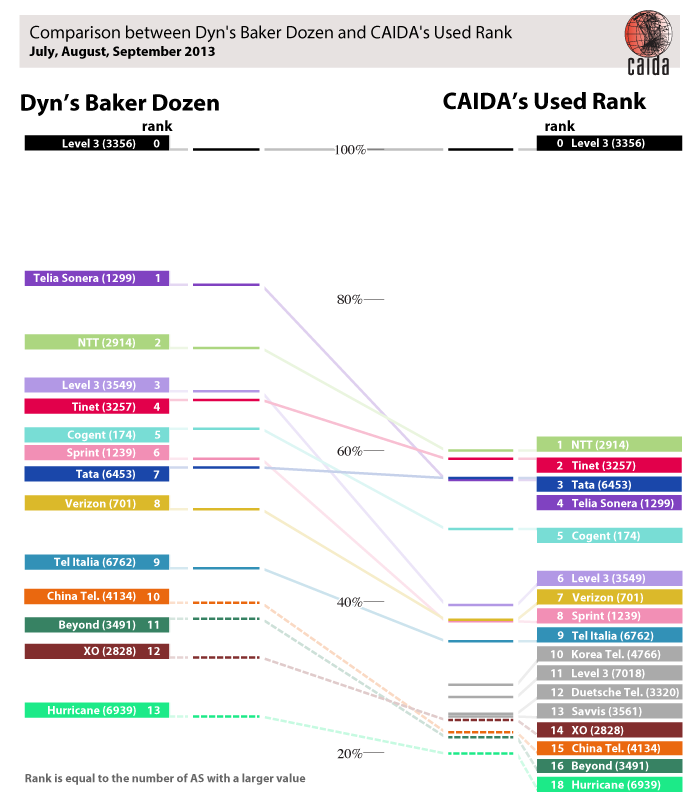
An AS’s rank is based on the number of ASes with a value (of the ranked metric) greater than the given AS. CAIDA’s 8th, 11th, and 13th ranked ASes are gray because we do not know their Dyn ranking.

as-prefix-percentage Hilbert map visulization shows utilization of IPv4 address space, rendered in two dimensions using as space-filling continous fractal Hilbert curve of order 12. Each pixel in the full resolution image represents a /24 block; red indicates used blocks, green unassigned blocks and blue RFC special blocks. Routed unused blocks are grey and unrouted assigned black

Although their order changes, the top nine ASes are the same in both rankings. Three of Dyn’s top-ranked ASes — China Telecom (AS4134), Beyond (AS3491), and Level 3 (AS3549) — are not in CAIDA’s top 14 ranked ASes; instead CAIDA’s top 14 includes AT&T (AS7018), Deutsche Telecom (AS3320), and Korea Telecom (AS4766). Some of this discrepancy can be explained by Dyn’s curation of the data, including “dealing with anomalies, discounting pre-CIDR allocations, ignoring short-lived announcements, counting remaining prefixes (non-linearly) based on size (/8 – /24 only), etc“. We assume these heuristics aim to make the number of transited addresses a closer approximation to the amount of transited traffic, which Dyn suggests is the more interesting ranking (in the same 2013 MENOG presentation).

We agree with Dyn that the number of IP addresses is not representative of traffic, and have always emphasized that we are not in a position to rank ASes by traffic transited. Not only is there huge variation in traffic to/from different IP addresses (e.g., home user versus popular web servers), but many announced IP addresses are not even assigned to any hosts. In an October 2013 study, CAIDA researchers found that of the 10.4M addresses announced in that month, only 5.3M (51%) were observed sending traffic (these “used” address blocks are shown as red in the Hilbert map on the right). This observation suggests another arguably more meaningful (but computationally expensive) method to rank ASes: normalizing by the amount of observably actively used address space.

July, August, and September 2013


Since we do not yet have census information for January 2015, we use July, August, and September 2013 usage data to compare Dyn’s 2013 ranking with CAIDA’s AS ranking weighted by the number of observably used /24 IPv4 prefixes in the customer cone. (A /24 is defined as “used” if the census observed it as in use.)

The results of this ranking by “observably used IPv4 address /24 blocks”-based customer cone (i.e., the number of apparently used /24 blocks in an AS’s customer cone) look more similar to the Dyn rankings, consistent with the fact that this method of calculating customer cones accounts for some of the effect Dyn captures by discounting pre-CIDR blocks, which are less likely to be fully utilized.
Dyn vs CAIDA's AS Ranking
An AS’s ranking is based on the number of ASes with a value greater than the given AS. The CAIDA’s 8th, 12th, and 13th ranked AS are colored gray to indicate that we do not have a known their Dyn ranking.
 2015   2013 
 dyn   address   address   used   dyn 
 2015 

dyn 1.00 0.82 0.83 0.86 0.82
address 0.82 1.00 0.74 0.66 0.49
 2013 

address 0.83 0.74 1.00 0.96 0.86
used 0.86 0.66 0.96 1.00 0.90
dyn 0.82 0.49 0.86 0.90 1.00

We computed the Pearson correlation coefficient between the results of the two ranking methods. A value of 1 shows perfect correlation or that the two systems have identical rankings. A 0 means there is no correlation or that the two rankings are completely different. Outside the comparison with themselves, which by definition produces 1.00, the two most similar rankings are Dyn’s 2013 transit addresses and CAIDA’s 2013 used /24s with a correlation of 0.90.

This approach improves the correlation between Dyn’s and CAIDA’s ranking (e.g., the Pearson correlation coefficient increases from 0.82 to 0.90, see Table), but it amplifies the dominance of the top-ranked AS (Level 3 AS3356) for CAIDA’s census-derived customer cone ranking.

If we correlate how the rankings have changed over the last two years — which we cannot do for the census-based ranking since we only have 2013 data — we find that Dyn’s ranking showed greater consistency (a correlation between the 2013 and 2015 rankings of 0.82 compared with CAIDA’s 0.74), perhaps due to their data curation process.

In summary, CAIDA’s IPv4 address-based customer cone and Dyn’s transited IPv4 address space roughly agree on the top ASes, although their relative weighting diverges.

Comments on Cybersecurity Research and Development Strategic Plan

Wednesday, July 1st, 2015 by kc

An excerpt from a comment that David Clark and I wrote in response to Request for Information (RFI)-Federal Cybersecurity R&D Strategic Plan, posted by the National Science Foundation on 4/27/2015.

The RFI asks “What innovative, transformational technologies have the potential to enhance the security, reliability, resiliency, and trustworthiness of the digital infrastructure, and to protect consumer privacy?

We believe that it would be beneficial to reframe and broaden the scope of this question. The security problems that we face today are not new, and do not persist because of a lack of a technical breakthrough. Rather, they arise in large part in the larger context within which the technology sits, a space defined by misaligned economic incentives that exacerbate coordination problems, lack of clear leadership, regulatory and legal barriers, and the intrinsic complications of a globally connected ecosystem with radically distributed ownership of constituent parts of the infrastructure. Worse, although the public and private sectors have both made enormous investments in cybersecurity technologies over the last decade, we lack relevant data that can characterize the nature and extent of specific cybersecurity problems, or assess the effectiveness of technological or other measures intended to address them.

We first examine two inherently disconnected views of cybersecurity, the correct-operation view and the harm view. These two views do not always align. Attacks on specific components, while disrupting correct operation, may not map to a specific and quantifiable harm. Classes of harms do not always derive from a specific attack on a component; there may be many stages of attack activity that result in harm. Technologists tend to think about assuring correct operation while users, businesses, and policy makers tend to think about preventing classes of harms. Discussions of public policy including research and development funding strategies must bridge this gap.

We then provide two case studies to illustrate our point, and emphasize the importance of developing ways to measure the return on federal investment in cybersecurity R&D.

Full comment:
http://www.caida.org/publications/papers/2015/comments_cybersecurity_research_development/

Background on authors: David Clark (MIT Computer Science and Artificial Intelligence Laboratory) has led network architecture and security research efforts for almost 30 years, and has recently turned his attention toward non-technical (including policy) obstacles to progress in cybersecurity through a new effort at MIT funded by the Hewlett Foundation. kc claffy (UC San Diego’s Center for Applied Internet Data Analysis (CAIDA)) leads Internet research and data analysis efforts aimed at informing network science, architecture, security, and public policy. CAIDA is funded by the U.S. National Science Foundation, Department of Homeland Security’s Cybersecurity Division, and CAIDA members. This comment reflects the views of its authors and not necessarily the agencies sponsoring their research.

Named Data Networking Next Phase (NDN-NP) Annual Report

Tuesday, June 30th, 2015 by kc

The Named Data Networking project recently published the NDN-NP annual report covering activities from May 2014 through April 2015.

V. Jacobson, J. Burke, L. Zhang, B. Zhang, K. Claffy, C. Papadopoulos, T. Abdelzaher, L. Wang, J. Halderman, and P. Crowley, “Named Data Networking Next Phase (NDN-NP) Project May 2014 – April 2015 Annual Report”, Tech. rep., Jun 2015.

This report catalogs a wide range of our accomplishments during the first year of the “NDN Next Phase (NDN-NP)” project. This phase of the project is environment-driven, in that we are focusing on deploying and evaluating the NDN architecture in two specific environments: building automation management systems and mobile health, together with a cluster of multimedia collaboration tools.

CAIDA takes over stewardship of Spoofer Project infrastructure

Thursday, May 28th, 2015 by Matthew Luckie

Originally started by Rob Beverly while a graduate student at MIT, the Spoofer project attempts to measure the Internet’s susceptibility to spoofed source address IP packets. From Rob’s original project web page (now moved to CAIDA, see below):

Malicious users capitalize on the ability to “spoof” source IP addresses for anonymity, indirection, targeted attacks and security circumvention. Compromised hosts on networks that permit IP spoofing enable a wide variety of attacks.

The project never had dedicated funding, but Rob believed that empirical data on how many networks permitted spoofing was important, so he kept the web site alive. In collaboration with him, we submitted a proposal to improve the measurement and analysis capabilities to inform one of the most important challenges in cybersecurity today: improving network hygiene to reduce the threat of the longest standing vector of attack on Internet infrastructure.
In addition to enabling us to provide estimates of how many networks allow packets with forged source addresses to leave their networks, we can use measurements from this infrastructure, in combination with other sources of data, to analyze the geographic, economic, and governance characteristics of networks that allow spoofing, versus those that do not, as well as trends over time of this network security hygiene policy.

This month, we celebrate a transition point in this project: in collaboration with Rob, we migrated the Spoofer software services to a new server on the machine room floor at the San Diego Supercomputer Center at UCSD, and, more relevant to users, we have released new clients for Microsoft Windows, Mac OS X, and Linux. We encourage users and operators to download and run the new clients to help measure the Internet’s susceptibility to spoofed source-addressed IP packets. Feedback is greatly appreciated as we expand functionality and hopefully footprint of this critical infrastructure security analysis project.

This research and infrastructure development effort is supported by an award from the Department of Homeland Security, Science and Technology Directorate.

Workshop on Internet Economics (WIE2014) Final Report

Tuesday, May 19th, 2015 by kc

The final report for our Workshop on Internet Economics (WIE2014) is available for viewing. The abstract:

On December 10-11 2014, we hosted the 4th interdisciplinary Workshop on Internet Economics (WIE) at the UC San Diego’s Supercomputer Center. This workshop series provides a forum for researchers, Internet facilities and service providers, technologists, economists, theorists, policy makers, and other stakeholders to inform current and emerging regulatory and policy debates. The objective for this year’s workshop was a structured consideration of whether and how policy-makers should try to shape the future of the Internet. To structure the discussion about policy, we began the workshop with a list of potential aspirations for our future telecommunications infrastructure (a list we had previously collated), and asked participants to articulate an aspiration or fear they had about the future of the Internet, which we summarized and discussed on the second day. The focus on aspirations was motivated by the high-level observation that before discussing regulation, we must agree on the objective of the regulation, and why the intended outcome is justified. In parallel, we used a similar format as in previous years: a series of focused sessions, where 3-4 presenters each prepared 10-minute talks on issues in recent regulatory discourse, followed by in-depth discussions. This report highlights the discussions and presents relevant open research questions identified by participants.

See the full workshop report at http://www.caida.org/publications/papers/2015/wie2014_report/

Slides from workshop presentations are available at http://www.caida.org/workshops/wie/1412/

Draft white paper that motivated the workshop at:
http://www.caida.org/publications/papers/2015/inventory_aspirations_internets_future/

RFC 7514 : Really Explicit Congestion Notification (RECN)

Wednesday, April 1st, 2015 by kc

I feel that somewhere up there Jon Postel is smiling about Matthew’s RFC 7514, published today:

The deployment of Explicit Congestion Notification (ECN) [RFC3168] remains stalled. While most operating systems support ECN, it is currently disabled by default because of fears that enabling ECN will break transport protocols. This document proposes a new ICMP message that a router or host may use to advise a host to reduce the rate at which it sends, in cases where the host ignores other signals such as packet loss and ECN. We call this message the “Really Explicit Congestion Notification” (RECN) message because it delivers a less subtle indication of congestion than packet loss and ECN.

http://www.rfc-editor.org/rfc/rfc7514.txt

Mapping the Technological Frontier and Sources of Innovation

Friday, February 13th, 2015 by kc

Last weekend I had the honor of participating in a conference on “The Digital Broadband Migration: First Principles for a Twenty First Century Innovation Policy” hosted by the Silicon Flatirons Center at the University of Colorado. David Clark and I kicked off a panel on the topic of “Mapping the Technological Frontier and the Sources of Innovation”. The full video is archived on YouTube (slides here). A great conference hosted by a great organization (and a law school that seems like a wonderful place to teach and learn).

Report from the 1st NDN Community Meeting (NDNcomm)

Tuesday, January 13th, 2015 by kc

The report for the 1st NDN Community Meeting (NDNcomm) is available online now. This report, “The First Named Data Networking Community Meeting (NDNcomm)“, is a brief summary of the first NDN Community Meeting held at UCLA in Los Angeles, California on September 4-5, 2014. The meeting provided a platform for the attendees from 39 institutions across seven countries to exchange their recent NDN research and development results, to debate existing and proposed functionality in security support, and to provide feedback into the NDN architecture design evolution.

The workshop was supported by the National Science Foundation CNS-1457074, CNS-1345286, and CNS-1345318. We thank the NDNcomm Program Committee members for their effort of putting together an excellent program. We thank all participants for their insights and feedback at the workshop.

North Korean Internet outages observed

Tuesday, December 23rd, 2014 by Alberto Dainotti

As reported by Dyn Research, North Korea has experienced extremely unstable Internet connectivity in the last few days. We offer a near real-time (30-minute delayed) view of the BGP-visibility of the 4 IPv4 prefixes announced by STAR-KP, Ryugyong-dong (North Korea’s national telecommunications provider). This real-time view represents a sneak peek of the intended outcomes of our Internet outage detection and analysis project.

(Click image below to get real-time view of observed BGP-reachability to North Korea.)

outageNK-23dec14

BGP data sources (30 min delay): RIPE NCC’s Routing Information Service (RIS), University of Oregon Route Views Project

architecture innovation 2020 (and 2030)

Friday, October 17th, 2014 by kc

Today I participated as a panelist in the Internet Regulation 2020 hosted by Duke Law’s Center for Innovation Policy at the National Academy of Sciences. The questions for my panel were:

What are the most significant realistic changes in network architecture, capacity, and connectivity by 2020? In what ways might these developments be affected, perhaps even precluded, by regulatory policy? In what ways might these developments in turn affect regulatory policy? What are the costs and benefits of these developments and their possible regulation?

My slides (which link to related reading on last slide):

http://www.caida.org/publications/presentations/2014/internet_architecture_innovation_duke/