What’s in a Ranking? comparing Dyn’s Baker’s Dozen and CAIDA’s AS Rank
July 2nd, 2015 by Bradley HuffakerThe Internet infrastructure is composed of thousands of independent networks (Autonomous Systems, or ASes) that engage in typically voluntary bilateral interconnection (“peering”) agreements to provide reachability to each other. Underlying these peering relationships, are business relationships between networks, although whether and how much money ASes exchange when they interconnect is not generally published. Some of these business relationships are relatively easy to infer with a high degree of confidence using a basic economic assumption that commercial providers do not give away traffic transit services (i.e., route announcements) for free.
For several years CAIDA has used publicly available BGP data to infer business relationships among ASes and, consequently, rank Autonomous Systems based on a measure of their influence in the global routing system, specifically the size of their customer cone. (An AS’s customer cone is the set of ASes, IPv4 prefixes, or IPv4 addresses that the AS can reach via its customers, i.e., by crossing only customer links.) The methodology behind our ranking is described in detail in our IMC2013 paper (“AS Relationships, Customer Cones, and Validation”). By default, CAIDA’s AS Rank sorts by the number of other ASes in each AS’s customer cone (an AS granularity), but the AS Rank web interface also supports sorting by the number of IPv4 prefixes or IPv4 addresses observed in each AS’s customer cone (which the web interface calls prefix or IP address granularities).
Other organizations also provide rankings of ASes; the most well-known is Dyn’s IP Transit Intelligence AS ranking. Since both CAIDA’s and Dyn’s rankings aim to use a metric that reflects some notion of “predominant role in the global Internet routing system”, we have received several inquiries on how our ranking methodology and results differ from theirs. In this essay we try to answer this question to the best of our ability, acknowledging that their methodology is proprietary and we do not know exactly what they are doing beyond what they have released publicly. This 2013 MENOG presentation (Dyn bought the Renesys company in 2014) states that their ranking is based on quantity of transited IP space, so the closest possible comparison to what we currently do would be to compare their ranking with our IP-address-based customer cone ranking (which is not currently our default). For this exercise we will compare CAIDA’s 1st January 2015 AS ranking by customer cone with the chronologically last value on Dyn’s 2014 Baker’s Dozen, which is based on data observed around the same date.
Dyn’s web site provides the following image showing their rankings throughout 2014: 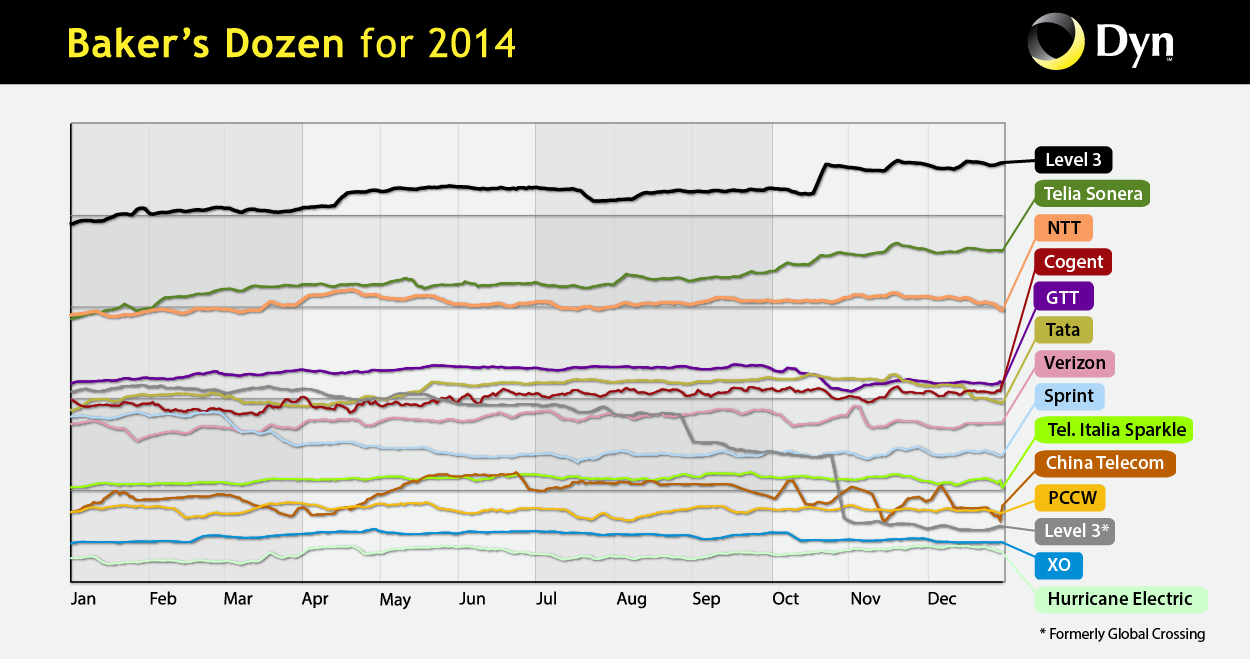
In order to compare not only the computed ranking, but the values of the metrics being ranked (i.e., transited IPv4 space vs. number of addresses in customer cone), we create a mapping between the two spaces. Dyn does not put numbers on their y-axis, and they plot only the top 13 ranked ASes, so we do not know the range of y-values represented. In order to make the comparison possible, we will (make a leap of faith and) assume that the top thirteen ranked ASes for each metric cover roughly the same rank of values. (We caution that this assumption may be unjustified and are trying to validate it with Dyn.) So we map the top ranked ASes in Dyn (Level 3 AS3356), to the top ranked AS in CAIDA (also Level 3 AS3356), and map the 13th-ranked AS in Dyn, (Hurricane AS6939), to the 13th ranked AS in CAIDA, (Korea Telecom AS4766). These upper and lower thresholds result in the following mapping between the transited IPv4 space and number of IPv4 addresses in customer cone:
| ASdyn_i.dyn_y = | ASdyn_i.transit_ip – ASdyn_13.transit_ip | + AScaida_13.number_addresses |
| AScaida_0.num_addresses – AScaida_13.num_addresses |
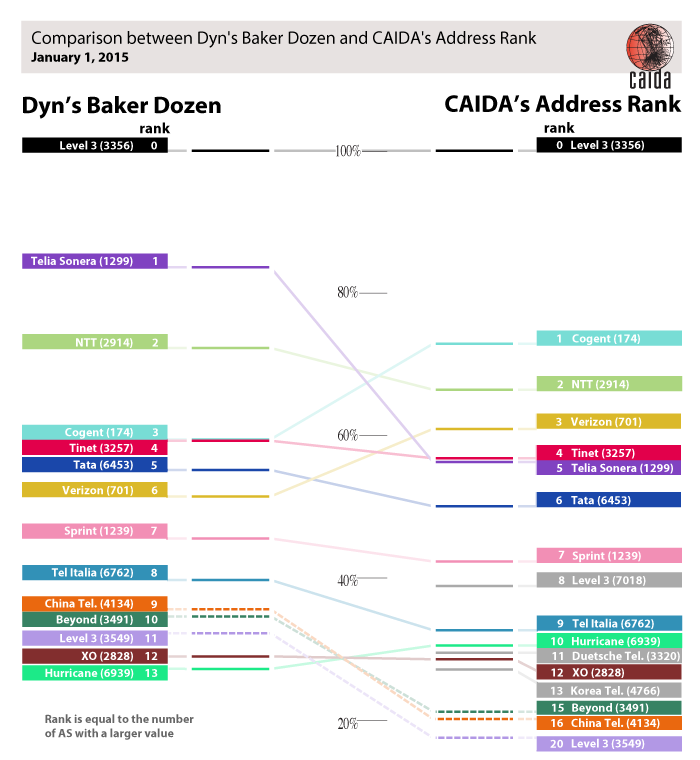
An AS’s rank is based on the number of ASes with a value (of the ranked metric) greater than the given AS. CAIDA’s 8th, 11th, and 13th ranked ASes are gray because we do not know their Dyn ranking.
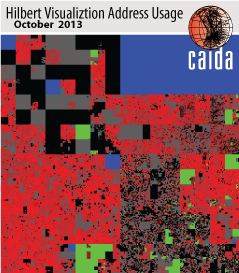 Hilbert map visulization shows utilization of IPv4 address space, rendered in two dimensions using as space-filling continous fractal Hilbert curve of order 12. Each pixel in the full resolution image represents a /24 block; red indicates used blocks, green unassigned blocks and blue RFC special blocks. Routed unused blocks are grey and unrouted assigned black
Although their order changes, the top nine ASes are the same in both rankings. Three of Dyn’s top-ranked ASes — China Telecom (AS4134), Beyond (AS3491), and Level 3 (AS3549) — are not in CAIDA’s top 14 ranked ASes; instead CAIDA’s top 14 includes AT&T (AS7018), Deutsche Telecom (AS3320), and Korea Telecom (AS4766). Some of this discrepancy can be explained by Dyn’s curation of the data, including “dealing with anomalies, discounting pre-CIDR allocations, ignoring short-lived announcements, counting remaining prefixes (non-linearly) based on size (/8 – /24 only), etc“. We assume these heuristics aim to make the number of transited addresses a closer approximation to the amount of transited traffic, which Dyn suggests is the more interesting ranking (in the same 2013 MENOG presentation).
We agree with Dyn that the number of IP addresses is not representative of traffic, and have always emphasized that we are not in a position to rank ASes by traffic transited. Not only is there huge variation in traffic to/from different IP addresses (e.g., home user versus popular web servers), but many announced IP addresses are not even assigned to any hosts. In an October 2013 study, CAIDA researchers found that of the 10.4M addresses announced in that month, only 5.3M (51%) were observed sending traffic (these “used” address blocks are shown as red in the Hilbert map on the right). This observation suggests another arguably more meaningful (but computationally expensive) method to rank ASes: normalizing by the amount of observably actively used address space.
July, August, and September 2013
Since we do not yet have census information for January 2015, we use July, August, and September 2013 usage data to compare Dyn’s 2013 ranking with CAIDA’s AS ranking weighted by the number of observably used /24 IPv4 prefixes in the customer cone. (A /24 is defined as “used” if the census observed it as in use.)
The results of this ranking by “observably used IPv4 address /24 blocks”-based customer cone (i.e., the number of apparently used /24 blocks in an AS’s customer cone) look more similar to the Dyn rankings, consistent with the fact that this method of calculating customer cones accounts for some of the effect Dyn captures by discounting pre-CIDR blocks, which are less likely to be fully utilized.
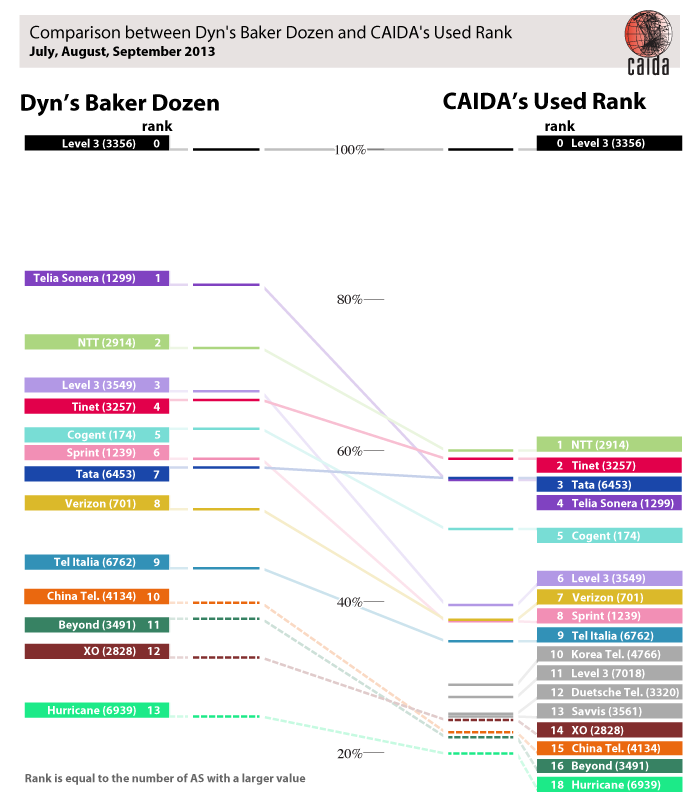
An AS’s ranking is based on the number of ASes with a value greater than the given AS. The CAIDA’s 8th, 12th, and 13th ranked AS are colored gray to indicate that we do not have a known their Dyn ranking.
| 2015 | 2013 | |||||||
|---|---|---|---|---|---|---|---|---|
| dyn | address | address | used | dyn | ||||
| 2015 | dyn | 1.00 | 0.82 | 0.83 | 0.86 | 0.82 | ||
| address | 0.82 | 1.00 | 0.74 | 0.66 | 0.49 | |||
| 2013 | address | 0.83 | 0.74 | 1.00 | 0.96 | 0.86 | ||
| used | 0.86 | 0.66 | 0.96 | 1.00 | 0.90 | |||
| dyn | 0.82 | 0.49 | 0.86 | 0.90 | 1.00 | |||
We computed the Pearson correlation coefficient between the results of the two ranking methods. A value of 1 shows perfect correlation or that the two systems have identical rankings. A 0 means there is no correlation or that the two rankings are completely different. Outside the comparison with themselves, which by definition produces 1.00, the two most similar rankings are Dyn’s 2013 transit addresses and CAIDA’s 2013 used /24s with a correlation of 0.90.
This approach improves the correlation between Dyn’s and CAIDA’s ranking (e.g., the Pearson correlation coefficient increases from 0.82 to 0.90, see Table), but it amplifies the dominance of the top-ranked AS (Level 3 AS3356) for CAIDA’s census-derived customer cone ranking.
If we correlate how the rankings have changed over the last two years — which we cannot do for the census-based ranking since we only have 2013 data — we find that Dyn’s ranking showed greater consistency (a correlation between the 2013 and 2015 rankings of 0.82 compared with CAIDA’s 0.74), perhaps due to their data curation process.
In summary, CAIDA’s IPv4 address-based customer cone and Dyn’s transited IPv4 address space roughly agree on the top ASes, although their relative weighting diverges.