Observing the DDoS Landscape Requires Collaboration
Saturday, December 21st, 2024 by Raphael HiesgenDistributed denial-of-service (DDoS) attacks are an ever-present phenomenon on the Internet. Over the years, many organizations and groups have undertaken efforts to reduce the feasibility and effectiveness of DDoS attacks, such as by disabling attack vectors (e.g., NTP’s get monlist), deploying source address validation (ingress & egress filtering), and enlisting law enforcement (booter takedowns). In addition, an industry of DDoS protection companies sells attack mitigation services. While these approaches have had some impact–who knows how dire the situation would be without such efforts?–DDoS remains a persistent threat.
A clear understanding and view of the DDoS landscape is the basis for developing and improving countermeasures. Our recent study comparatively evaluated long-term DDoS trends in academia and industry to better understand the current limitations. We focused on two classes of DDoS attacks: direct-path (DP) attacks and reflection-amplification (RA) attacks. In a direct-path attack, packets are sent directly to the target of the attack. One group of DP attacks establishes connections to abuse application layer protocols, while others use randomly spoofed source addresses. In a reflection-amplification attack, requests are spoofed to contain the source address of the attack target and sent to a reflective third party service (e.g., DNS), which then sends the replies to the victim.
Collecting DDoS Datasets
Our study analyzed longitudinal DDoS trends across academia and industry. We collected 10 datasets from seven observatories listed in Table 1. Each observatory shared 4.5 years of weekly attack counts for our long-term trend analysis. The observatories from academia additionally shared raw DDoS event data, which enabled us to analyze the visibility of targets across observatories. We further collected and analyzed 24 DDoS threat reports from 22 companies for the year 2022. We published the detailed analysis as an artifact at https://ddoscovery.github.io.
| Observatory | Type | Coverage | DP Attack Trends | RA Attack Trends |
|---|---|---|---|---|
| UCSD NT | Network Telescope | 12M IPs | Increase 🔺 | (not applicable) |
| ORION NT | Network Telescope | 500k IPs | Increase 🔺 | (not applicable) |
| Netscout Atlas | On-path Network | Proprietary | Increase 🔺 | Increase 🔺 |
| Akamai Prolexic | On-path Network | Proprietary | Neutral 🔴 | Neutral 🔴 |
| IXP Blackholing | On-path Network | Proprietary | Increase 🔺 | Decrease 🔻 |
| AmpPot | Honeypot | ~30 IPs | (not applicable) | Neutral 🔴 |
| Hopscotch | Honeypot | 65 IPs | (not applicable) | Decrease 🔻 |
| Industry Reports | PDF/website/etc. | 22 Companies | Increase 🔺 | Increase 🔺 and Decrease 🔻 |
Long-term Attack Trends Depend on the Viewpoint
Our analysis of attack trends revealed that even observatories that agree on long-term trends (Table 1) exhibit many differences in short-term patterns, reflecting different views of the DDoS landscape. For the analysis, we normalized the weekly attack counts to the median of the first 15 weeks. We plot the exponentially weighted moving average (EWMA) with a 12-week window and linear regressions starting in 2019 and ending in 2022.
Direct-path Attack Trends
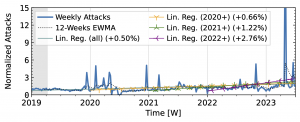
Both network telescopes (Fig. 1) observed an increase in attacks during the measurement period. They repeatedly saw short peaks that at least tripled attack counts, but did not coincide across both observatories. ORION saw its largest peaks in 2022Q1 and Q2, with smaller peaks in 2019Q2 and mid-2021. In contrast, UCSD saw its largest peak in 2023, with small peaks in each year. While ORION observed a decline in 2023 compared to 2022, UCSD trends remained positive.
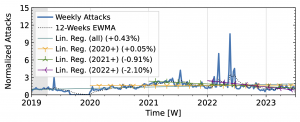
The time series from one of our industry observatories (Figure 2) did not show large peaks. Netscout Atlas (Fig. 2a) experienced stable growth, except in 2021. Akamai Prolexic (Fig. 2b) fluctuated around its baseline with a slight decrease in attacks overall. Both companies likely have stable customer bases and are less affected by sudden bursts in attacks. Both companies saw a rise in attacks in 2020, followed by a decline in 2021. Netscout saw a rise throughout 2022, while Akamai saw peaks in 2022 but no persistent increase. Both companies detected a rise in attacks in 2023.
Reflection-amplification Attack Trends
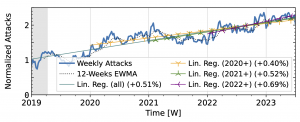
The honeypots in our study (Fig. 3) showed a significant increase in attacks in 2020 after a decline in 2019Q4. Hopscotch recorded most attacks early in 2020, while AmpPot saw its highest peaks later, coinciding with a decline in attack counts at Hopscotch. Both HPs detected a continued decline in 2021, aligning with industry efforts to deploy SAV (see discussion in the paper, Section 2.3). While both time series shared a peak in mid-2022, the peak was much more pronounced in the Hopscotch data.
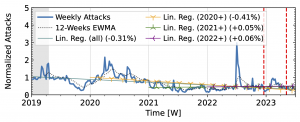
Figure 3 a): Long-term trends of reflection-amplification attacks observed by Hopscotch. The red dashed lines mark DDoS takedown efforts by law enforcement.
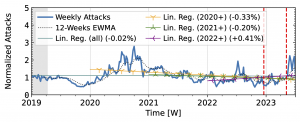
Figure 3 b): Long-term trends of reflection-amplification attacks observed by AmpPot. The red dashed lines mark DDoS takedown efforts by law enforcement.
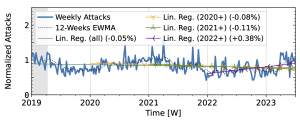
Akamai Prolexic (Fig. 4 a) experienced only small variations in attacks until 2020Q3 before they surged above 2x its baseline in 2021Q1. This peak coincided with a peak in the IXP time series (Fig. 4 b). However, the IXP already saw a steep rise in attacks starting in 2019Q4, with peaks in 2021Q1 and Q2. Both time series declined until the end of 2022, with more pronounced peaks in the Akamai time series. They both detected an increase in attacks in 2023 but had a neutral to negative trend overall.
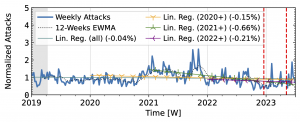
Figure 4 a): Long-term trends of reflection-amplification attacks observed by Akamai Prolexic. The red dashed lines mark DDoS takedown efforts by law enforcement.
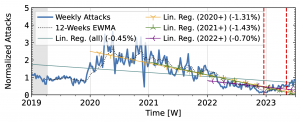
Figure 4 b): Long-term trends of reflection-amplification attacks observed in IXP Blackholing. The red dashed lines mark DDoS takedown efforts by law enforcement.
Booter takedowns by law enforcement. We marked known booter takedowns by law enforcement with red dashed lines in Figures 3 and 4. Booters offer DDoS-as-a-service usually relying on reflection-amplification attacks. The first takedown in late 2022Q4 led to immediate, small valleys in all graphs. In contrast, the 2023Q2 takedown did not affect the AmpPot time series (Fig. 3 b). Instead, attack counts increased. While we do not know how trends would have evolved without interference, the impact on DDoS trends appears limited in our time series.
Why do Views on DDoS Differ?
We investigated the cause of these differences by comparing DDoS targets across observatories (Section 7 in our paper). The analysis revealed that our four observatories from academia saw a substantial share of targets that were not seen by the other three. While the overlap among observatories of the same type, i.e., either honeypots or network telescopes, was considerable, each observatory provided a unique view into the DDoS attack landscape. This highlights the limitations of individual datasets and the root cause of different views of the DDoS landscape. Overlap between observatories from academia and industry was similarly limited. Thus, cooperation with industry partners is a valuable–and potentially necessary–source for improved visibility.
Recommendations
Our analysis of 10 longitudinal datasets from 7 observatories revealed the limited view that researchers have as a basis for DDoS research. Without an accurate view we can neither accurately plan actions nor evaluate their outcome.
Advice for researchers: DDoS research tries to make global inferences based on local views. Accepting and acknowledging the limitations of available datasets is important for accurate interpretation and comparison. When possible, researchers should analyze multiple datasets, which generally requires collaboration with operators. In parallel, stakeholders across academia and industry need to converge on specific frameworks for data sharing to facilitate comparison. Unexplored details include the definition of incidents and their impact, data formats to accommodate comparisons, disclosure control technologies, and access policies to allow rigorous independent analyses.
Advice for threat-intelligence companies: Collaborate with researchers. Gathering reliable data on DDoS attacks is challenging. Getting additional data from different vantage points–especially those that academia usually has no access to–is invaluable for researchers. We found that many DDoS reports are only available after providing email addresses and are not archived for long-term access. Lowering the effort to read reports and archiving historical reports increases visibility and perspective on trends over time. Since language is often not consistent across companies and since vantage points and methodologies differ, comparisons to previous reports from the same company are especially relevant to analyze long-term changes in the DDoS landscape.
Advice for operators: Spoofing is an integral mechanism abused in many DDoS attacks, including all reflection-amplification attacks and a significant subset of direct-path attacks. Source address validation (SAV) is an effective tool to stop these attacks. Supporting ongoing research and extending measurement systems to quantify the deployment of SAV and reveal persistent sources of spoofed packets is a challenging but worthwhile undertaking.
Let’s collaborate to achieve a comprehensive view of DDoS!
Paper Reference: Raphael Hiesgen, Marcin Nawrocki, Marinho Barcellos, Daniel Kopp, Oliver Hohlfeld, Echo Chan, Roland Dobbins, Christian Doerr, Christian Rossow, Daniel R. Thomas, Mattijs Jonker, Ricky Mok, Xiapu Luo, John Kristoff, Thomas C. Schmidt, Matthias Wählisch, KC Claffy, The Age of DDoScovery: An Empirical Comparison of Industry and Academic DDoS Assessments, In: Proc. of ACM Internet Measurement Conference (IMC), p. 259–279, ACM : New York, 2024. https://doi.org/10.1145/3646547.3688451
