Archive for September, 2016

CRA Congressional visit to Washington D.C.

Tuesday, September 27th, 2016 by kc

As part of a Computing Research Association (CRA) effort to introduce policymakers to the contributions and power of IT research for the nation and the world, this month I had the honor of visiting with the offices of four U.S. senators and a U.S. Representative:

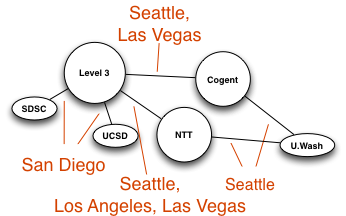
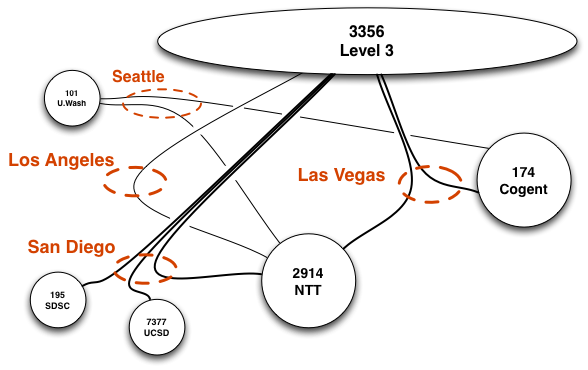
Internet-specific topics I discussed included the importance of scientific measurement infrastructure to support empirical network and security research, broadband policy, and Internet governance.

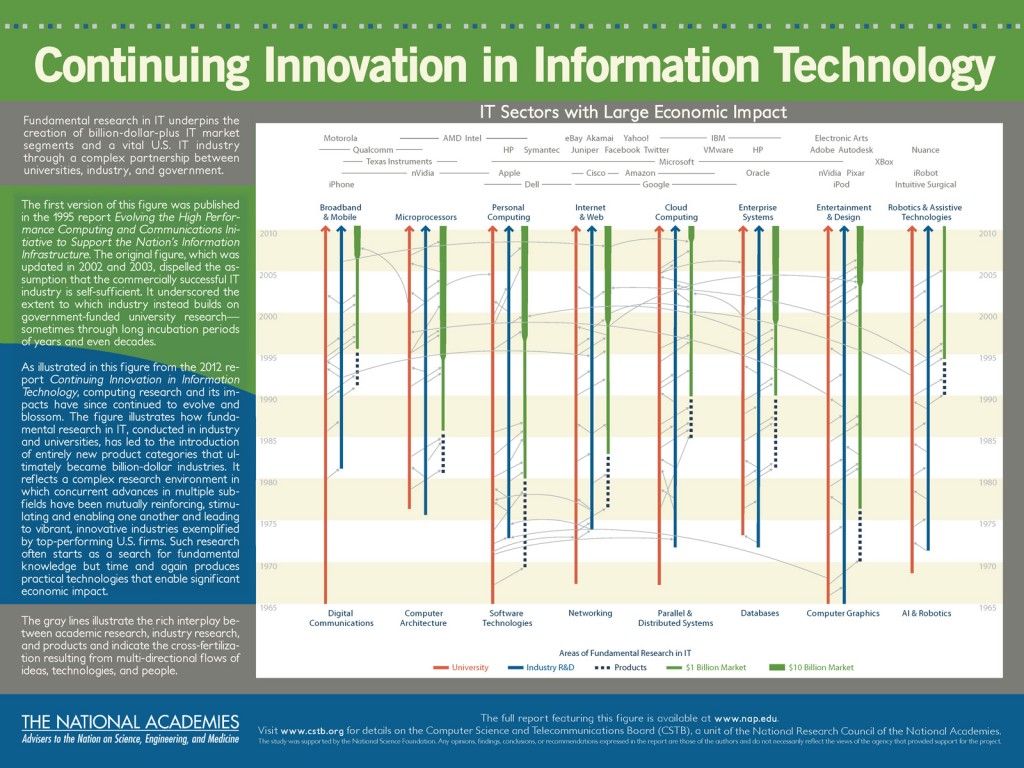
We left them with a terrific infographic from the National Academy study “Continuing Innovation in Information Technology“, which shows the economic impact of different areas of fundamental IT research. The 2-pager flyer and the whole National Academy report, Depicting Innovation in Information Technology, is available on the National Academies of Science, Engineering, and Medicine Computer Science Telecommunications Board (CSTB) site.
Continuing Innovation in Information Technology

Even with many folks in Congress having a higher priority of passing a budget and getting back home to their districts to prepare for elections, all the staffers were gracious and genuinely interested in our field. (Who wouldn’t be? 😉 )

Kudos to the Computing Research Association for providing a wonderful opportunity to engage with policy folks.

Adding geographic annotations to ISP interconnects

Tuesday, September 20th, 2016 by Bradley Huffaker
AS links  annotated geographic locations.

Geographic annotations on AS links.

The Internet arises from the interconnection of thousands of independently operated networks. Its structure is often modeled as a collection of Autonomous Systems (ASes), nodes, exchanging traffic across interconnects, links. These models are reductive by nature, with large international organizations made up of thousands of machines and cables reduced to a single node, and multiple exchange points reduced to a single link.

We extended this model with the introduction of geographic locations attached to links between ISPs, represented by ASes. This extension maintains the simple node and link structure of the AS graph, and allows us to capture some of the geographic complexity in the topology.

AS graphic with geographic locations.

AS graphic with geographic locations.

Consider the path from UCSD to U.Washington depicted in the illustration above. Level 3 has two possible paths: Level 3 âž¡ Cogent âž¡ U.Wash and Level 3 âž¡ NTT âž¡ U.Wash. Both paths have the same AS path length. Assuming Level 3 uses hot-potato routing, in order to spend as little money on carrying traffic as possible, it transfers the traffic as soon as possible onto another provider. In this example, NTT’s Los Angeles connection is closer to San Diego than Cogent’s Las Vegas connection, so Level 3 chooses to route the traffic through NTT.

AS links path

In addition to supporting research on path prediction, these type of geographic annotations of links can provide a more realistic indication of the network’s resilience to link failure. In the figure below, duplicate links between ASes reflect multiple interconnects between ASes. e.g., this figure implies that a single link failure would disconnect UCSD from Level 3, while three links would have to fail for Level 3 and NTT to become disconnected.

 Shows multiple links between ASes that connect in multiple locations.

Shows multiple links between ASes that connect in multiple locations.

Details on our geographic link annotation methods and this data is available at CAIDA’s AS Relationships with geographic annotations page.