Under the Telescope: Time Warner Cable Internet Outage
Friday, August 29th, 2014 by Vasco AsturianoIn the early hours of August 27th 2014, Time Warner Cable (TWC) suffered a major Internet outage, which started around 9:30am and lasted until 11:00am UTC (4:30am-6:00am EST). According to Time Warner, this disconnect was caused by an issue with its Internet backbone during a routine network maintenance procedure.
A few sources have documented the outage based on BGP and/or active measurements, including Renesys and RIPE NCC. Here we present a view from passive traffic measurement, specifically from the UCSD Network Telescope, which continuously listens for Internet Background Radiation (IBR) traffic. IBR is a constantly changing mix of traffic caused by benign misconfigurations, bugs, malicious activity, scanning, responses to spoofed traffic (backscatter), etc. In order to extract a signal usable for our inferences, we count the number of unique source IP addresses (in IBR observed from a certain AS or geographical area) that pass a series of filters. Our filters try to remove (i) spoofed traffic, (ii) backscatter, and (iii) ports/protocols that generate significant noise.
Most of TWC’s Autonomous Systems seem to have been affected during the time of the reported outage. Our indicators from the telescope show a total absence of traffic from TWC’s ASes, indicating a complete network outage.
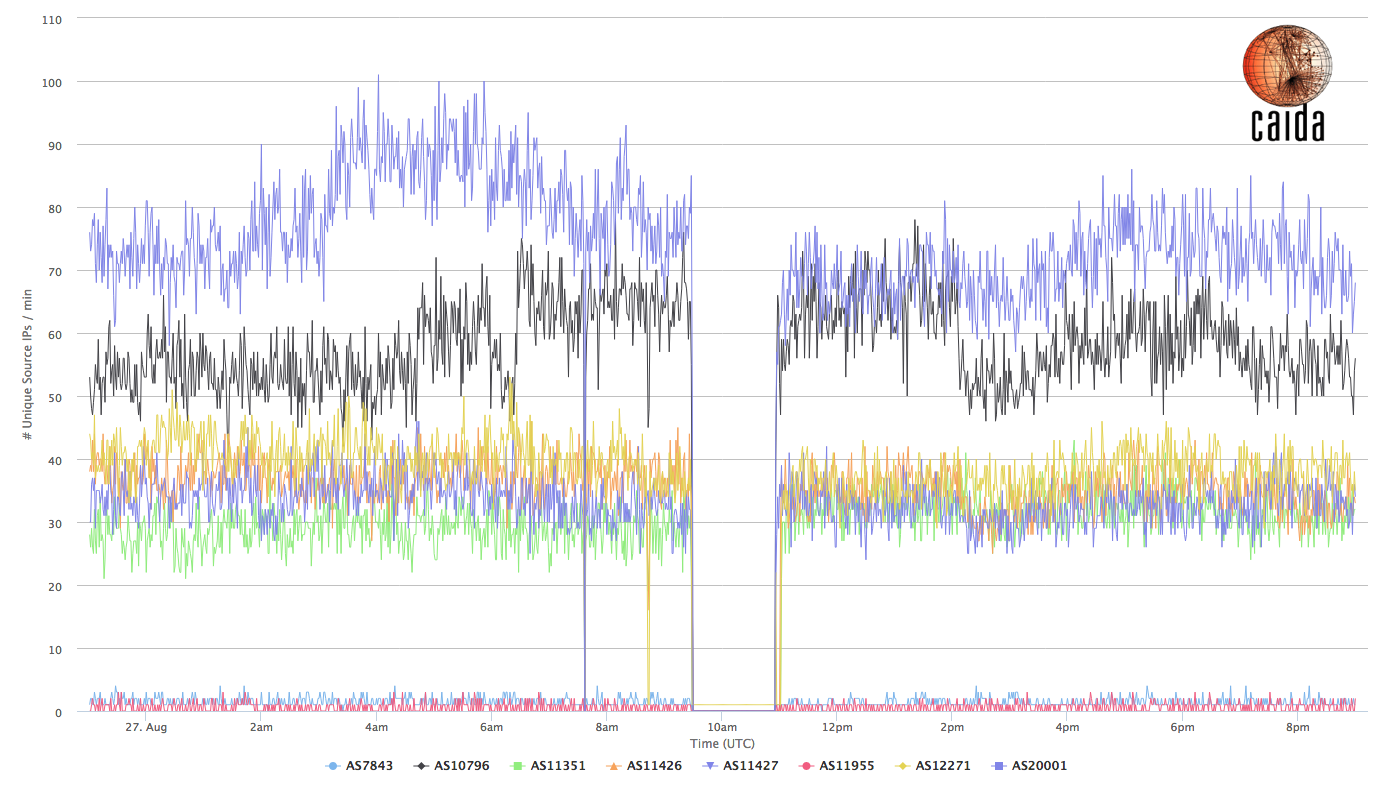
Figure 1: Number of unique IBR source IPs (after filtering) observed per minute for the TWC ASes
Figure 1 shows the number of unique source IPs originated by TWC ASes per minute, as observed by the network telescope; we plot only TWC ASes from which there was any IBR traffic observed just before and after the event. For reference, these ASes are: AS7843, AS10796, AS11351, AS11426, AS11427, AS11955, AS12271 and AS20001.
TWC is a large Internet access provider in the United States, and this IBR signal can also reveal insight into the impact of this outage across the country. Figure 2 shows the same metric as Figure 1, but for source IPs across the entire country, indicating a drop of about 12% in the number of (filtered) IBR sources, which suggests that during the incident, a significant fraction of the US population lost Internet access.
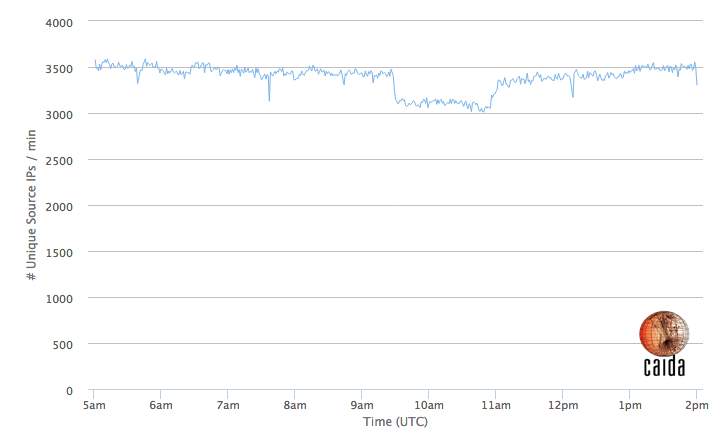
Figure 2: Number of unique IBR source IPs (after filtering) observed in the US
Drilling down to a regional level shows which US states seem to have suffered a larger relative drop in traffic.
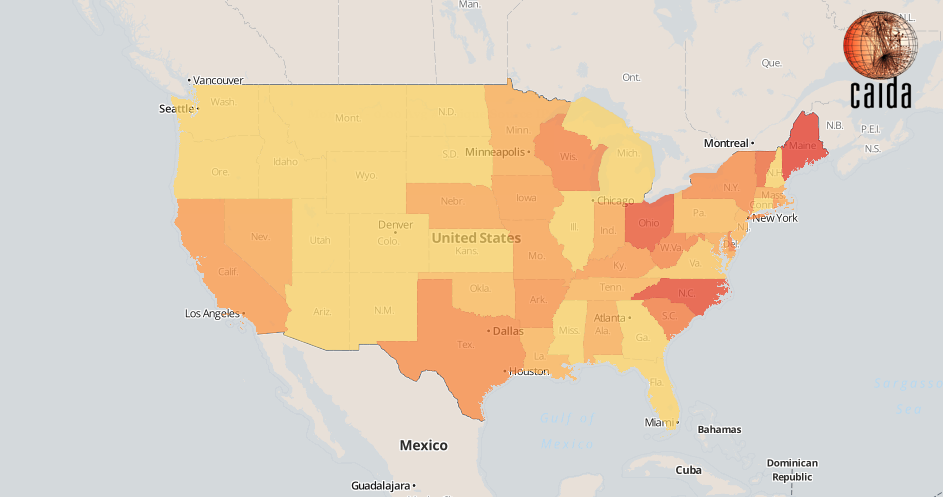
Figure 3: Decrease ratio of unique IBR source IPs per US state
Figure 3 compares the number of IBR sources observed in the 5 minute-interval just before the incident (9:25-9:30UTC) to the 5-minute interval after it (9:30-9:35UTC). The yellow to red color gradient represents the ratio at which a certain state’s IBR sources have decreased (redder means larger drop). States that did not suffer a substantial relative decrease are shown in yellow. This geographical spread is likely correlated with market penetration of TWC connectivity within each state.