Unsolicited Internet Traffic from Libya
March 23rd, 2011 by Emile AbenAmidst the recent political unrest in the Middle East, researchers have observed significant changes in Internet traffic and connectivity. In this article we tap into a previously unused source of data: unsolicited Internet traffic arriving from Libya. The traffic data we captured shows distinct changes in unsolicited traffic patterns since 17 February 2011.
Most of the information already published about Internet connectivity in the Middle East has been based on four types of data:
In this article we discuss another type of Internet measurement data that can be useful in monitoring macroscopically visible Internet events: unsolicited packets destined to unused address space. Similar to the notion of Cosmic Microwave Background Radiation, this Internet “background noise” of unsolicited packets consists of packets sent by misconfigured hosts, hosts that are scanning the network, or victims of DoS attacks with spoofed source addresses.
On 21 November 2008, the amount of unsolicited traffic at the UCSD network telescope (described below) grew dramatically with the advent of the Conficker worm, which widely infected Windows hosts and actively scanned for hosts to infect on TCP port 445. From that point on about 60-80% of unsolicited Internet traffic is via TCP port 445. Sufficiently pervasive worms such as Conficker allow informed estimates of aggregate infection rates — in this case of a vulnerable (ie. unpatched) Windows population — by monitoring traffic to unassigned IP address space.
The Conficker worm scans whenever a host is online, although its rate of scanning is higher when it detects no user activity on a machine (see this report by Symantec). So the amount of unsolicited traffic originating from Conficker’s network scanning allows us to see hosts that are online, but where the user is not actively generating Internet traffic.
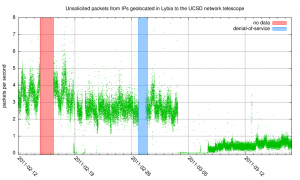
The UCSD network telescope captures traffic destined to the unassigned address space in a /8 network, with relatively few blocks in this /8 where end hosts are active. Filtering this data for source addresses from a specific region provides an indication of host activity for that region. We used the MaxMind GeoIP Lite database, January 2011 edition, to map IP addresses to geographic regions, and recorded the per-second packet rate (averaged over 60 seconds) from address ranges that geolocated to Libya. Figure 1 shows five weeks of these packet-per-second averages, and Figures 2, 3 and 4 show the same data zoomed in to interesting 2-day, 3-day and 7-day intervals, respectively.

Figure 1. Five weeks of observed unsolicited Internet traffic from IP address blocks that geolocated to Libya according to MaxMind GeoIP Lite database, January 2011 edition.
Figure 1 shows unsolicited one-way traffic for five weeks, including some “silent” gaps with absolutely no traffic, and other intervals with larger and more typical levels. During these five weeks there was an interval of about one-and-a-half days where the data collection server didn’t collect data, indicated in light red with label ‘no data’, and for a period of about a day where traffic levels were almost always higher then 8 packets per second (pps), indicated in light blue with label ‘denial-of-service’. Figure 1 also shows a number of intervals with next to no traffic, notably in the 18 – 21 February period and between 3 and 8 March. This is shown in more detail in Figure 3 and Figure 4 below. After 8 March the amount of unsolicited traffic is slowly picking up again, but not to the levels from before 3 March.

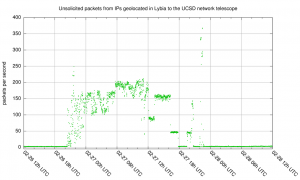
Figure 2. Two days of observed unsolicited Internet traffic from IP address blocks that geolocated to Libya according to MaxMind GeoIP Lite database, January 2011 edition.
Figure 2 shows a 2-day period that includes an interval of higher packet rates, labeled “denial-of-service” in Figure 1, on a different y-scale. Where outside of this period the packet rate usually is below 5 pps, during this period the packet rates received go up to 367 pps at the highest peak. While the unsolicited traffic outside this interval is dominated by traffic to TCP/445, the higher-packet rates interval is dominated by SYN/ACK packets from TCP/80 from a single source IP address to seemingly random destinations in the UCSD network telescope. This is typical “backscatter” of a denial-of-service attack, in this case of a single webserver we geolocated to Libya. There are intervals where packet rates stay around 50, 100, 150 and 200 pps, which could point at an attacker stepping their attack up and down. Note that we only saw a small fraction of the return traffic from this attack, but it looks like this attack was very modest by current standards (see for instance this news report on a tens of millons of pps attack on WordPress).

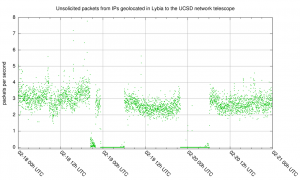
Figure 3. Unsolicited Internet traffic during 18 - 21 February 2011 from IP address blocks that geolocated to Libya according to MaxMind GeoIP Lite database, January 2011 edition.
Figure 3 shows two distinct overnight outages consistent with Arbor Networks’s netflow measurements during the same period (18 – 21 February 2011). Interestingly in both cases, a small trickle of traffic begins right before the outage ends. Occasional traffic is often observed during these outages, which could be an artifact of traffic with spoofed IP addresses or inaccuracy in the geolocation database we used for prefix selection.

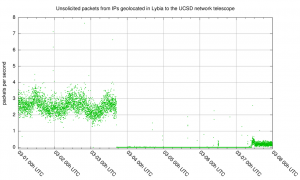
Figure 4. Unsolicited Internet traffic during 1 - 8 March 2011 from IP address blocks that geolocated to Libya according to MaxMind GeoIP Lite database, January 2011 edition.
Figure 4 reveals a longer outage visible from approximately 3 March 18:00 UTC to 7 March 11:00 UTC. The traffic levels after this outage were significantly lower then before. Figure 1 shows a slow subsequent increase after this outage to roughly 20% of pre-outage traffic levels. In Google’s transparency index search queries are less then 5% of pre-outage levels, so it seems that the few hosts we observe sending out unsolicited traffic after this outage do significantly fewer search queries to Google than the population of hosts before the outage. It is unclear if this is due to stricter filtering of traffic to Google, and potentially other websites. A tiny spike in traffic around 12 March 19:58 UTC to pre-outage levels is visible in Figure 1, and also visible in Google’s data, which could be interpreted as a temporary glitch of an Internet filter.
Conclusion
Ironically, the insidious pervasive reach of malware like the Conficker worm enables observation and detection of macroscopic changes in Internet behaviour.
In this case we saw several anomalies in the amount of unsolicited traffic out of networks we geolocated to Libya over the last couple of weeks.
CAIDA is coordinating further analysis of this data by a team of vetted researchers. Please comment below if you have any questions.
March 24th, 2011 at 6:27 am
What is causing the small trickle of traffic just before the outages end in Libya? Does this in any way help predict when a country will end its internet outage?
March 30th, 2011 at 12:23 am
Hi Adam,
Unclear what causes the small trickle of traffic just before the outages, it could be because some networks got their Internet connectivity back a little bit before others. I don’t think it helps in any way to predict the end of these Internet outages, because every outage is different.