CAIDA’s IPv6 measurement and analysis activities
April 29th, 2011 by kcIn pursuit of more rigorous data on IPv6 deployment, CAIDA has undertaken four IPv6 measurement and analysis exercises: address allocation data; traceroute-based topology; DNS queries from root servers; and a global survey of network operators in 2008.
Address allocation
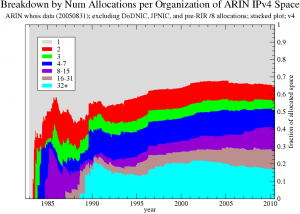
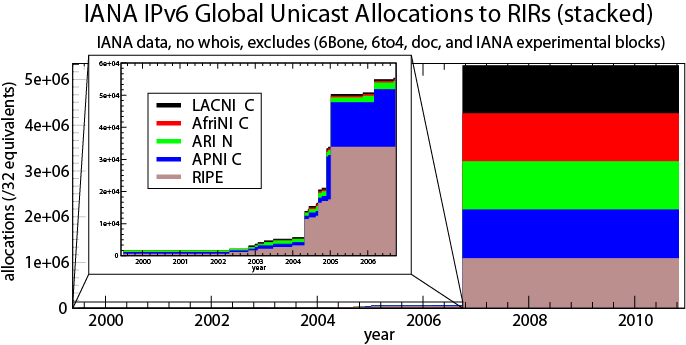
In 2005 ARIN sponsored CAIDA to analyze statistics on IPv4 and IPv6 address allocation [1], with a focus on evaluating demand drivers for address space [2][3]. Figure 1 shows the number of IPv4 prefixes allocated per organization over time, and reveals that allocations tend to go to organizations that already have allocations rather than to new entrants to the field. As of August 2005, old players constituted only between 2% and 11.2% of organizations with address space, but they held more than half of the address space. Figure 2 shows IANA’s release of IPv6 space to the registries. The left plot shows a zoomed in subset of IPv6 address allocation until 2006, and indicates that the U.S. region (ARIN) has historically had significantly lower interest in IPv6 than Europe and Asia (RIPE and APNIC, correspondingly). This disparity is consistent with the U.S. holding the majority of the IPv4 space today. In October 2006 IANA implemented a radical policy shift trying to promote IPv6 deployment, giving so much IPv6 address space (a /12) to each regional Internet registry (RIR) to temporarily remove IANA from the equation [4], reflected in the plot on the right of Figure 3. Assuming everyone gives out a /48 (the typical IPv6 prefix allocation size at the time), a /12 gives each RIR an address space to allocate 16 times the size of the entire IPv4 address space. Unsurprisingly, especially in the face of low IPv6 deployment, no RIR has come back to IANA with additional IPv6 addressing needs since then.

Figure 1. Breakdown by Num Allocations per Organization of ARIN IPv4 Space ARIN whois data ; excluding DoDNIC, JPNIC, and pre-RIR /8 allocations; v4

Figure 2: IANA allocation of IPv6 address prefixes to the five regional Internet registries (RIRs) over time.
IP topology measurement
CAIDA has been measuring, analyzing, modeling, and visualizing global Internet topology for over a decade. Our newest active measurement infrastructure Archipelago (Ark) [5] currently has 54 monitors deployed in 29 countries (as of March 2011) and conducts ongoing coordinated large-scale traceroute-based topology measurements. Ark-based IPv4 topology measurements began in September 2007. In December 2008, we started measurements of IPv6 topology using six IPv6-capable monitors, now 16 of our monitors are IPv6-capable. All topology data that we collect are available to academic and government researchers by request [6][7].
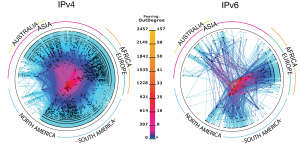
A well-regarded application of our topology data is the AS-core map visualizing global Internet connectivity. Figure 3 exhibits IPv4 and IPv6 AS-core maps produced in August 2010. For the IPv4 map, CAIDA collected data from 45 Ark monitors located in 24 countries on 6 continents that probed paths toward 17 million /24 networks covering 96% of the routable prefixes seen in the Route Views (BGP) routing tables [8] on 1 August 2010. For the IPv6 map, CAIDA collected data from 12 Ark monitors located in 6 countries on 3 continents. This subset of monitors probed paths toward 307K destinations spread across 3302 IPv6 prefixes which represent 99.6% of the globally routed IPv6 prefixes seen in Route Views on 1 August 2010. To produce the final AS-core maps, we combine the topology view from each monitor into a topology of Autonomous Systems (ASes), which correspond to Internet Service Providers (ISPs) and other organizations participating in interdomain routing. We plot ASes and their links in polar coordinates with the radius equal to the observed outdegree of an AS and 5 allocations (/32 equivalents) allocations (/32 equivalents) the angular coordinate corresponding to the geographical location (longitude) of an AS [9].
The 2010 IPv6 AS-core map consists of 715 AS nodes and 1,672 links (inferred peering sessions) between ASes. For comparison, our previous 2008 IPv6 AS-core map[14] included 515 AS nodes and 1,175 AS-links. In neither 2009 nor 2010 are the top degree-ranked ASes the same across IPv4 and IPv6. The IPv4 core is centered primarily in the United States, while the IPv6 core includes Europe. We observed no high-degree “hub” IPv6 ASes in Asia, surprising given the reportedly large IPv6 deployment in Asia. This gap may reflect the geographic bias of our IPv6-capable monitor deployment: five in the US, four in Europe, and only one in Asia.
Though the IPv4 graph is far larger than the IPv6 graph, the two graphs share many structural properties. Although the maximum degree AS in the IPv4 graph is an order of magnitude larger than for the IPv6 graph, the graphs have similar average AS degrees (5.6 and 4.3, respectively) and average shortest AS path distances (3.5 and 3.3, respectively). The two AS graphs have exactly the same radius of 4 and diameter of 8. These similarities reflect the preference of network operators for short AS paths in both IPv4 and IPv6.
DNS data from “Day in the Life of the Internet” project
For a separate project, we collected and analyzed the largest simultaneous collection of full-payload packet traces from a core component of the global Internet infrastructure ever made available to academic researchers. This dataset consists of four large samples of global DNS traffic collected at participating DNS root servers during annual Day in the Life of the Internet (DITL) experiments conducted in January 2006, January 2007, March 2008, and March 2009 [11].
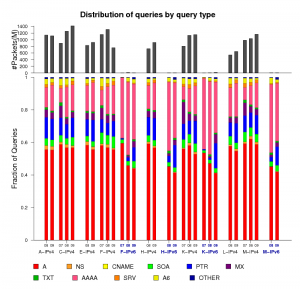
Native IPv6 traffic is still negligible at root servers who measure it, although at four root servers (C, F, K, and M) we observed a progressive yearly increase since 2007 in AAAA queries, which map a hostname to an IPv6 address, using IPv4 for transport. In 2008 we attributed this increase to more clients using operating systems with native IPv6 capabilities such as Apple’s MacOSX and Microsoft’s Windows Vista [11], which can launch IPv6 queries (in IPv4 packets) even if IPv6 transport is not available. The increase in 2009 is larger, from around 8% on average to 15%. Some of this increase is due to the addition of IPv6 glue records to six of the root servers in February 2008 [12], and does not necessarily reflect use of IPv6 by applications.
Figure 4 shows the distribution of queries by type observed at eight participating DNS root servers. A-type queries, used to request an IPv4 address for a given hostname, are the most common about 60% of the total, consistently across years. For the four root servers (C, F, K, and M) that have participated in DITL since 2007, Figure 4 shows a progressive yearly increase in AAAA-type queries, which map a hostname to an IPv6 address, using IPv4 for transport. In 2008 we attributed this increase to more clients using operating systems with native IPv6 capabilities such as Apple’s MacOSX and Microsoft’s Windows Vista [11], which can launch IPv6 queries (in IPv4 packets) even if IPv6 transport is not available. The increase in 2009 is larger, from around 8% on average to 15%. Some of this increase is due to the addition of IPv6 glue records to six of the root servers in February 2008 [12]. The far fewer queries actually carried by IPv6 transport to the root servers (columns with x-axis labels in blue) are a more reliable indication of IPv6 traffic levels and consistent with statistics shown above.
Survey of RIR members
In collaboration with ARIN, we conducted two surveys via the RIR membership email lists, inviting subscribers to fill out a web survey. Our first survey in March 2008 was constrained to the ARIN region only 347 respondents participated. In the second survey conducted in September 2008 we had 1060 survey participants from all five RIRs spanning all geographic regions [13][14]. In early 2009 the European Union decided to re-use our survey [15] to begin to establish some history on IPv6 deployment activity in the European Union; they now do the survey in all five RIR regions and present results at RIPE meetings [16].
Over 70% of survey respondents said their primary motivation for investing resources in IPv6 was “to be ahead of the game.” Respondents self-classified as from educational or government organizations were almost twice as likely to have begun their transition toward IPv6 than commercial organizations. Yet, when asked about present hurdles hindering IPv6 deployment, respondents vented their frustration. Obstacles mentioned included registry policies and procedures, lack of quality support for routers, middleboxes and applications, a general lack of IPv6 expertise, and a reluctance to invest resources in the absence of an immediate profitable return — consistent with the fact that less profit-focused or budget-constrained organizations were more likely to report some kind of IPv6 activity. However, and acknowledging the self-selection bias of the survey, nearly half of respondents answered that they do plan to make the transition to IPv6, while about a third said they were going to “wait and see”. No one reported carrying significant IPv6 traffic. Perhaps most disturbing and yet least surprising, survey respondents collectively expected to need more IPv4 addresses in the next two years than remain in the unallocated pool.
Implications
The scant data available reveal two concerns: (1) architectural transitions, even those deemed not radical but critical, are slow; (2) the U.S. is behind other regions of the world, and has not thus far invested in shedding quantitative light on this problem, despite making attempts to lightly nudge the market toward IPv6 adoption.
References
- [1] kc claffy, Apocalypse then: IPv4 address space depletion, Oct. 2005.
- [2] B. Huffaker, Y. Hyun, and kc claffy, “IPv4 Address Space Concentration”, 2008.
- [3] Y. Hyun, “IPv6 Address Space Concentration”, 2008.
- [4] J. Sweeting, “Policy 2004-8: Allocation of ipv6 address space by the internet assigned numbers authority (iana) policy to regional internet registries”, 2006.
- [5] Y. Hyun and CAIDA, “Archipelago Measurement Infrastructure”, 2009.
- [6] CAIDA, “The IPv4 Routed /24 Topology Dataset”, 2009.
- [7] CAIDA, “The IPv6 Topology Dataset”, 2009.
- [8] D. Meyer, “University of Oregon Route Views Project”.
- [9] CAIDA, “Visualizing IPv4 and IPv6 Internet Topology at a Macroscopic Scale”, 2009.
- [10] CAIDA, “Visualizing IPv6 AS-level Internet Topology 2008”, 2008.
- [11] S. Castro, D. Wessels, M. Fomenkov, and k claffy, “A Day at the Root of the Internet,” ACM SIGCOMM Computer Communications Review, Oct. 2008.
- [12] IANA, “IPv6 Addresses for the Root Servers”, 2008.
- [13] kc claffy, Bradley Huffaker, Young Hyun, “ARIN and CAIDA IPv6 Survey Summary – April 2008,” Apr. 2008.
- [14]kc claffy and CAIDA, “ARIN and CAIDA IPv6 Survey Summary – October 2008,” October 2008.
- [15] M. Botterman, “EU IPv6 survey proposed to May 2009 RIPE meeting”, 2009.
- [16] M. Botterman, “2010 IPv6 survey results, presented at RIPE 61”, 2009.

