Twelve Years in the Evolution of the Internet Ecosystem
April 10th, 2012 by Amogh DhamdhereOur recent study of the evolution of the Internet ecosystem over the last twelve years (1998-2010) appeared in the IEEE/ACM Transactions on Networking in October 2011. Why is the Internet an ecosystem? The Internet, commonly described as a network of networks, consists of thousands of Autonomous Systems (ASes) of different sizes, functions, and business objectives that interact to provide the end-to-end connectivity that end users experience. ASes engage in transit (or customer-provider) relations, and also in settlement-free peering relations. These relations, which appear as inter domain links in an AS topology graph, indicate the transfer of not only traffic but also economic value between ASes. The Internet AS ecosystem is highly dynamic, experiencing growth (birth of new ASes), rewiring (changes in the connectivity of existing ASes), as well as deaths (of existing ASes). The dynamics of the AS ecosystem are determined both by external business environment factors (such as the state of the global economy or the popularity of new Internet applications) and by complex incentives and objectives of each AS. Specifically, ASes attempt to optimize their utility or financial gains by dynamically changing, directly or indirectly, the ASes they interact with.
The goal of our study was to better understand this complex ecosystem, the behavior of entities that constitute it (ASes), and the nature of interactions between those entities (AS links). How has the Internet ecosystem been growing? Is growth a more significant factor than rewiring in the formation of new links? Is the population of transit providers increasing (implying diversification of the transit market) or decreasing (consolidation of the transit market)? As the Internet grows in its number of nodes and links, does the average AS-path length also increase? Which ASes engage in aggressive multihoming? Which ASes are especially active, i.e., constantly adjust their set of providers? Are there regional differences in how the Internet evolves?
To answer these questions, we analyzed AS-level topology snapshots constructed from publicly available routing tables collected at Routeviews/RIPE. We selected a series of topology snapshots spaced 3 months apart, spanning twelve years from 1998-2010. Unfortunately, the available historical datasets from RouteViews/RIPE are not sufficient to study the evolution of settlement-free peering links. So we restricted the focus of this study to the evolution of AS types and of customer-provider links. We developed a method to classify ASes (with 75-80% accuracy according to our validation efforts, detailed in our recent TON paper) into a number of types depending on their business function, using observable topological properties of those ASes. The AS types we consider are large transit providers (LTP), small transit providers (STP), content/access/hosting providers (CAHP), and enterprise networks (EC).
Our findings highlight some important trends and evidence for how these trends may play out in the future:
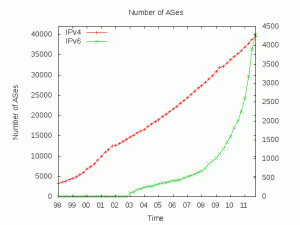
- The IPv4 AS-level Internet has gone through two growth phases: an initial exponential phase up to mid/late-2001, followed by a slower exponential growth thereafter. Contrast this with the growth of the IPv6 AS-level graph, which has been growing exponentially since 2003.

(More analysis comparing growth trends in the IPv4 and IPv6 topologies coming soon!) - The average path length, however, remains practically constant around 4 AS hops, meaning that the network densifies.
- Currently, 81% of link births are associated with existing ASes rather than new ASes (rewiring versus growth); similarly, 86% of the link deaths are due to rewiring. This implies that most of the dynamics in the network are due to births and deaths of links between existing ASes.
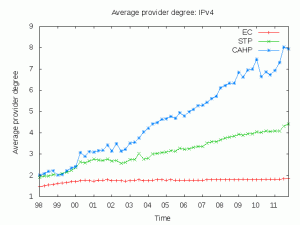
- We classified ASes according to economic considerations and business types. We find that most of the growth is due to Enterprise Customers (ECs) at the network edge. The average multihoming degree of ECs has remained roughly constant, but has increased significantly for other network types — transit providers (both regional and global), and Content/Access/Hosting providers. The previously mentioned densification process is thus driven by transit providers and content/access/hosting providers. In terms of rewiring, CAHPs appear to be the most active, while ECs are the least active.

- We introduced two provider metrics, attractiveness and repulsiveness, to quantify the ability of a provider to attract and retain customers. We found that both the attractiveness and repulsiveness of a provider are correlated to its customer degree. Also, many providers exhibit strong repulsiveness 3-9 months after exhibiting attractiveness, i.e., these providers attracted new customers but were unable to retain them. We define the set of providers that accounted for 70% of all customer gains across two consecutive topology snapshots as attractors, and the set of providers that accounted for 70% of all customer losses as repellers. We found that the set of attractors and repellers is increasing in size. This set of providers is dominated by those in North America and Europe; while the number of such providers in Europe is increasing, that number in other regions is relatively flat. This indicates that the market of transit providers, at least in Europe, does not seem to be consolidating.
- With respect to regional growth, we find that the Internet market, in terms of the number of enterprise, access/hosting/content and transit networks is now larger in Europe than in North America. Additionally, since 2004-2005, a larger fraction of active customers (customers that changed their set of providers between two consecutive snapshots) are in Europe than in North America. We note that these trends refer to the number of networks in various regions, and do not reflect the size of their customer base or advertised IP address space. Our measurements hint at an increasing European influence on the Internet ecosystem.
We have made the datasets collected as part of this work publicly available. We have also developed an interactive interface to the data that allows a user to query the historical connectivity (number of customers, providers, and peers) of a set of ASes. The user can also compare the connectivity of selected ASes with the average of different types of ASes — classfied according to their business types as Enterprise Customer, Small Transit Provider, Large Transit Provider, and Content/Access/Hosting Provider. We also allow the option of computing the degrees at the level of organizations. The user must enter an AS number belonging to the organization (e.g., 7018 for AT&T), and if a matching organization is found for that AS number, we display the connectivity of the organization as a whole. We are in the process of expanding our AS-to-organization database, so in the future the script will incorporate a larger set of AS-organization mappings.